


在我发贴后,@gynamics 提出 plist 遍历需要判断列表中的项是否为键(在楼下自己否定了),并提出如果以 zipped 方式遍历会提高效率。此外他还怀疑 plist-get 默认使用 equal 判断相等。
2025-05-31 07:27 #3 by gynamics
plist 访问需要解析列表中每一项,看它是不是 key,alist 只需要解析 key。这和相关函数的实现有关,如果 plist 底层使用 zipped 的方式遍历,效率应该会高很多(但是不安全,因为不能排除某个 key 没有值的情况)。alist 长度刚好是 plist 两倍的情况,性能差不多的。
可以尝试自己实现一个这样的 plist-get 试试。
2025-05-31 08:07 #4 by gynamics
我去查了下,有两个版本的实现:
plist-get使用的是equal,key是符号的情况下使用eqget用的是eq考虑到 key 的值一般是符号,但是不一定总是符号,
考虑到 equal 的符号在 elisp 里实际不一定eq,所以 get 可能不合你的预期。(
get是从maclisp继承来的原语。maclisp里面任何两个equal的原子都eq的)我之前提到的不安全的 zipped traverse 没有出现。
2025-05-31 13:44 #7 by gynamics
> #6 by include-yy
> plist 需要遍历的列表长度更长。这个影响应该非常小,性能开销的大头在对列表成员的检查上。如果 plist 是严格的 pair list,只检查为 key 的奇数项不会浪费时间。
@Kana 跑了一下 perf 命令,发现 plist 和 alist 的指令数都差不多,但是 alist-get 的 IPC 差不多是 plist-get 的一倍,而且两者的缓存命中率和分支预测没有太大区别。他还考虑到了内存对其的问题, car 是 16 字节对齐而 cdr 是 8 字节对齐,这可能导致访问前者更快(后面自己的帖子也给否了):
2025-05-31 15:44 #9 by Kana
跑了一下 perf,但仍然看不出来什么……
命令及输出
$ perf stat -B -e cache-references,cache-misses,cycles,instructions,branches,branch-misses emacs -q --batch --script test.el --eval '(test-alist (t-create-alist 2000) 2000 2000)'

 Performance counter stats for 'emacs -q --batch --script test.el --eval (test-alist (t-create-alist 2000) 2000 2000)':

     1,664,859,118      cache-references:u
        37,560,924      cache-misses:u                   #    2.26% of all cache refs
    22,989,245,371      cycles:u
    89,163,920,063      instructions:u                   #    3.88  insn per cycle
    29,026,961,366      branches:u
        21,303,743      branch-misses:u                  #    0.07% of all branches

       5.229262209 seconds time elapsed

       5.180081000 seconds user
       0.023831000 seconds sys


$ perf stat -B -e cache-references,cache-misses,cycles,instructions,branches,branch-misses emacs -q --batch --script test.el --eval '(test-plist (t-create-plist 2000) 2000 2000)'

 Performance counter stats for 'emacs -q --batch --script test.el --eval (test-plist (t-create-plist 2000) 2000 2000)':

     1,661,666,301      cache-references:u
        37,152,948      cache-misses:u                   #    2.24% of all cache refs
    40,751,947,902      cycles:u
    84,247,031,479      instructions:u                   #    2.07  insn per cycle
    24,801,242,536      branches:u
        21,350,234      branch-misses:u                  #    0.09% of all branches

       9.235591770 seconds time elapsed

       9.183998000 seconds user
       0.022889000 seconds sys
二者的执行指令数量都差不多,但是 IPC(insn per cycle)不知为什么差异巨大:
alist-get是 3.8 IPC,而plist-get是 2.07 IPC,减了将近一半。常见的解释一般是缓存命中率或是分支预测有问题,但二者这两项也大同小异……不知道有没有比较熟悉底层调优的人来分析一下。二者一个循环的操作也几乎一致
第 1 列 第 2 列 plist alist (consp list) (consp list) (consp (cdr list)) (consp (car list)) 非 cons 时跳出循环 非 cons 时继续下个循环 (eq (car list) key) (eq (caar list) key) (setq list (cddr list)) (setq list (cdr list)) 当然上面
perf结果里也显示二者instructions:u差不太多就是了。想了想,还有一种可能是对齐问题。如果 16-byte 对齐的地址访问比 8-byte 对齐的更快的话 [citation needed],那么
Lisp_Cons的car应该一般是 16-byte 对齐的,而紧跟后面的 cdr 就只能是 8-byte 对齐了。plist操作cdr更多,而alist的car更多,说不定能说明速度差异?
2025-06-01 16:49 #13 by Kana
> #10 by include-yy
> 同样键值对数量下,plist 是 alist 长度的一倍,可能就是这个原因但其实 plist 和 alist 都需要访问 2N 个 cons,而且上面 perf 结果也显示二者所需的执行指令数差异不大,可能和 list 长度关系不大。主要困惑的点是二者指令的执行效率差异太大了。
> #11 by gynamics
> 我用-O2 -g3编了一个 emacs 跑测试,两边访问的数据都不是对齐的。但是 cdr 踩到的热点似乎更多一些。的确不是对齐的问题:试用了下 aider,简单用 C 实现了 cons 和 alist-get 及 plist-get,仍然有显著的速度差异,即使调转 car 和 cdr 的顺序让 cdr 放在前面进行 16byte 对齐。
https://github.com/gudzpoz/alist-plist-benchmark
把
car和cdr互换后,二者的汇编可以说是指令级的一致:
alist循环plist循环一致? mov (%rdi), %raxmov (%rdi), %rax🟩 cmp %rsi, (%rax)cmp %rsi, %x8(%rdi)❌ je :break_loopje :break_loop🟩 mov 0x8(%rdi), %rdimov (%rax), %rdi❌ test %rdi, %rditest %rdi, %rdi🟩 jne :loop_startjne :loop_start🟩 我是想不明白了,或许和指令间的数据依赖导致无法流水线并行有关?
@acoret(2025-06-01 17:58 #14)认为 plist(也可能是 alist)更符合缓存机制,并建议使用其他 Scheme 复现一下 plist 和 alist。
@cireu(2025-06-02 15:42 #16)认为 plist 更长,所以需要的 pointer chasing 更多。
当然,这一猜想已经由 @gynamics 否定了,不过我们可以借此机会先简单了解一下 plist 和 alist 的结构:
plist:(k1 v1 k2 v2 k3 v3 ...)alist:((k1 . v1) (k2 . v2) (k3 . v3) ...)
在查找过程中, plist-get 每轮循环会取两次 CDR 到达下一个 KV 键值对,判断当前表头的 CAR 是否与查找键相同,若相同则返回当前表头的 CADR,否则继续循环; alist-get 每轮循环会取一次 CDR 到达下一个 KV CONS,判断表头的 CONS 的 CAR 是否与查找键相同,若相同则返回 KV CONS 的 CDR,否则继续循环。它们的查找过程可以使用如下伪代码表示:
(defun pesudo-pget (plist key)
  (while (and plist (not (eq (car plist) key)))
    (setq plist (cdr (cdr plist))))
  (and plist (car (cdr plist))))

(defun pesudo-aget (key alist)
  (while (and alist (not (eq (car (car alist)) key)))
    (setq alist (cdr alist)))
  (and alist (cdr (car alist))))
在上面的循环体中,每次循环 pesudo-pget 会取两次 CDR 和一次 CAR; pesudo-aget 会取两次 CAR 和一次 CDR。考虑到 CONS 的 CAR 和 CDR 是对齐且紧邻的,CAR 和 CDR 的调用开销应该几乎一致,仅凭上面的 Lisp 代码不足以解释为什么 alist-get 比 plist-get 更快。
这里我们可以顺便了解一下什么是 zipped 遍历(zipped iteration),它指的是同时遍历两个或多个可迭代对象,并在每次迭代中从每个对象中获取对应位置的元素。当然对 plist 来说我们只有一条列表,可以考虑把它按照奇偶拆成两条然后使用 cl-mapc 来遍历。
最后我们来介绍一下 map.el 这个内置的 Elisp 库,它为 Elisp 的关联数据结构(plist, alist 和 hashtable)提供了多态函数,比如 map-elt 可以用来查找这三种数据类型的键对应值:
(map-elt '(:a 1 :b 2) :b)                  ;;=> 2
(map-elt '((a . 1) (b . 2)) 'b)            ;;=> 2
(map-elt #s(hash-table data (a 1 b 2)) 'b) ;;=> 2@gynamics 提到 plist-get 使用的是 equal, 但是 (这一条被他自己否定了)。考虑到 equal 的符号在 elisp 里实际不一定 eqequal 会进行“深度比较”,这可能成为 plist-get 和 alist-get 的性能差距的主要原因。不过通过 plist-get 和 alist-get 的 docstring 来看,它们默认使用的是 eq:
plist-get is a primitive-function in ‘C source code’.

(plist-get PLIST PROP &optional PREDICATE)

Declared type: (function (list t &optional t) t)

Extract a value from a property list.
PLIST is a property list, which is a list of the form
(PROP1 VALUE1 PROP2 VALUE2...).

This function returns the value corresponding to the given PROP, or
nil if PROP is not one of the properties on the list.  The comparison
with PROP is done using PREDICATE, which defaults to ‘eq’.
alist-get is a native-comp-function in ‘subr.el’.
(alist-get KEY ALIST &optional DEFAULT REMOVE TESTFN)
Inferred type: (function (t t &optional t t t) t)
Find the first element of ALIST whose ‘car’ equals KEY and return its ‘cdr’.
If KEY is not found in ALIST, return DEFAULT.
Equality with KEY is tested by TESTFN, defaulting to ‘eq’.如果键比较是最主要的性能开销,那么 plist/alist 的查找用时就主要与待查键值对在列表中的位置有关,而与 plist/alist 长度差距无关(若 plist 和 alist 具有完全相同的键值对,那么前者是后者长度的一倍)。plist-get 和 alist-get 内部使用的 plist_get 和 assq 子例程(subr)都直接使用了 EQ 进行比较,在 64 位系统上这 几乎 就是简单的值比较:
#define lisp_h_XLI(o) ((EMACS_INT) (o))
#define lisp_h_BASE_EQ(x, y) (XLI (x) == XLI (y))
#define BASE_EQ(x, y) lisp_h_BASE_EQ (x, y)

/* Return true if X and Y are the same object.  */
INLINE bool
(BASE_EQ) (Lisp_Object x, Lisp_Object y)
{
  return lisp_h_BASE_EQ (x, y);
}

/* Return true if X and Y are the same object, reckoning a symbol with
   position as being the same as the bare symbol.  */
INLINE bool
EQ (Lisp_Object x, Lisp_Object y)
{
  return BASE_EQ ((__builtin_expect (symbols_with_pos_enabled, false)
		   && SYMBOL_WITH_POS_P (x) ? XSYMBOL_WITH_POS_SYM (x) : x),
		  (__builtin_expect (symbols_with_pos_enabled, false)
		   && SYMBOL_WITH_POS_P (y) ? XSYMBOL_WITH_POS_SYM (y) : y));
}
上面的 EQ 还带了一些奇怪的 SYMBOL_WITH_POS ,不过这是编译时才用到的信息:b0ba0d4 * src/lisp.h (EQ): Improve generated code.
Outside compilation 'symbols_with_pos_enabled' is always false, so ask the compiler to organize the most likely execution path in a sequential fashion in order to favor run-time performance.
在子例程 plist_get 和 assq 中可以看到比较方法就是 EQ ,而且两者的最大区别可能是 plist_get 使用了 FOR_EACH_TAIL_SAFE 而 assq 使用了 FOR_EACH_TAIL ,以及每轮循环 plist_get 实际上取了两次 XCDR :
plist_get-and-assq
/* Faster version of Fplist_get that works with EQ only.  */
Lisp_Object
plist_get (Lisp_Object plist, Lisp_Object prop)
{
  Lisp_Object tail = plist;
  FOR_EACH_TAIL_SAFE (tail)
    {
      if (! CONSP (XCDR (tail)))
	break;
      if (EQ (XCAR (tail), prop))
	return XCAR (XCDR (tail));
      tail = XCDR (tail);
    }
  return Qnil;
}
DEFUN ("assq", Fassq, Sassq, 2, 2, 0,
doc: /* Return non-nil if KEY is `eq' to the car of an element of ALIST.
The value is actually the first element of ALIST whose car is KEY.
Elements of ALIST that are not conses are ignored. */)
(Lisp_Object key, Lisp_Object alist)
{
Lisp_Object tail = alist;
FOR_EACH_TAIL (tail)
if (CONSP (XCAR (tail)) && EQ (XCAR (XCAR (tail)), key))
return XCAR (tail);
CHECK_LIST_END (tail, alist);
return Qnil;
}当然,我们可以看看当性能开销真正在键比较上是个什么情况,下面的代码使用字符串而不是符号作为键,使用 string= 而不是默认的 eq 来比较。下图说明这种情况下 alist/plist 查找性能没有明显差距,大部分时间都用在 string 比较上了:
test
(setq pl
      (let ((res))
	(dotimes (x 64)
	  (push (format "%03d" x) res)
	  (push t res))
	(nreverse res)))
(setq al
      (let ((res))
	(dotimes (x 64)
	  (push (cons (format "%03d" x) t) res))
	(nreverse res)))

(defun test-pl (ls epoch)
  (let ((keys (map-keys ls)) res)
    (dolist (k keys)
      (let* ((run (benchmark-run epoch (plist-get ls k #'string=)))
	     (time (/ (car run) 1.0 epoch)))
	(push time res)))
    (nreverse res)))

(defun test-al (ls epoch)
  (let ((keys (map-keys ls)) res)
    (dolist (k keys)
      (let* ((run (benchmark-run epoch (alist-get k ls nil nil #'string=)))
	     (time (/ (car run) 1.0 epoch)))
	(push time res)))
    (nreverse res)))

(let ((native-comp-speed 3))
  (native-compile 'test-pl)
  (native-compile 'test-al))

(setq res-p (test-pl pl 1000000))
(setq res-a (test-al al 1000000))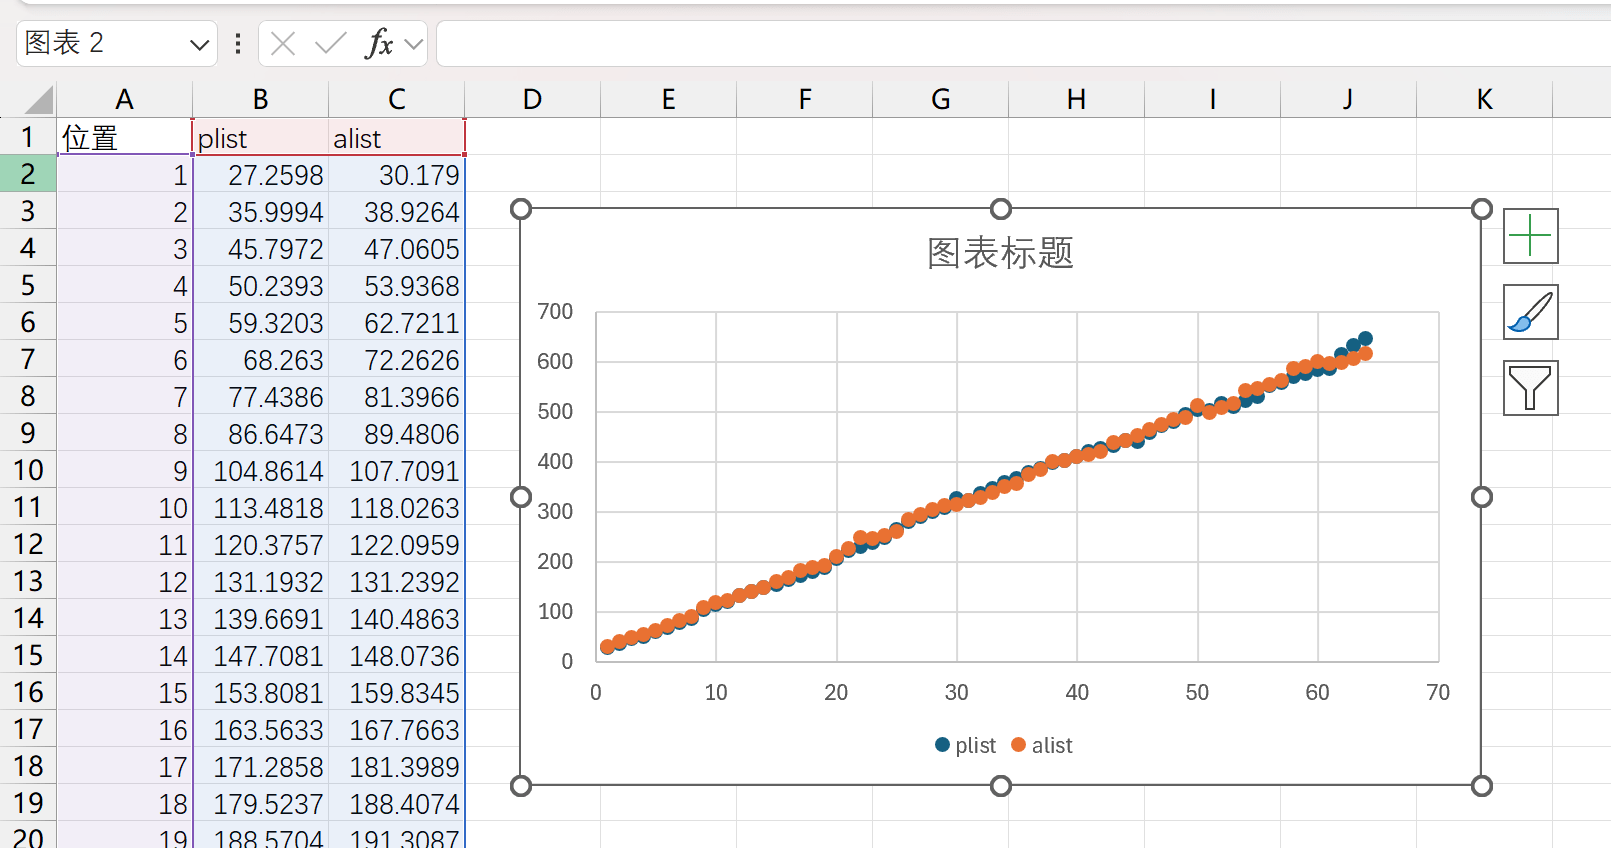
这一猜想由 @Kana 提出和否定,不过我们可以借此机会看看 Lisp_Cons 的数据结构:
struct Lisp_Cons
{
  union
  {
    struct
    {
      /* Car of this cons cell.  */
      Lisp_Object car;

      union
      {
	/* Cdr of this cons cell.  */
	Lisp_Object cdr;

	/* Used to chain conses on a free list.  */
	struct Lisp_Cons *chain;
      } u;
    } s;
    GCALIGNED_UNION_MEMBER
  } u;
};
结构中包含两个 Lisp_Object 成员 car 和 cdr ,其中 cdr 和一个叫做 chain 的成员在同一联合体中, chain 被用来管理空闲 cons。在 64 位系统中 Lisp_Cons 占用 16 个字节,是 16 字节对齐的。考虑到缓存行(Cache line)一般是 64 字节,单个 Lisp_Cons 不太可能出现跨缓存行的情况。
当然 @Kana 想说的是 16 字节对齐的 CAR 可能比 8 字节对齐的 CDR 访问更快,因为 plist_get 访问了两次 CDR 和一次 CAR ,而 assq 访问了两次 CAR 和一次 CDR ,这也许能解释为什么 assq 比 plist_get 快。但他通过交换 CAR 和 CDR 在 Lisp_Cons 中的位置的测试否定了这一点:
既然 CAR, CDR 调用开销基本上没有差距,那么有没有可能是因为 CONS 在内存中太过分散导致频繁的 cache miss(缓存未命中)呢?在内存 离散 这一点上 plist 和 alist 基本上是五十步笑百步的区别,至于内存是否 集中 主要取决于 Elisp 的分配方法。
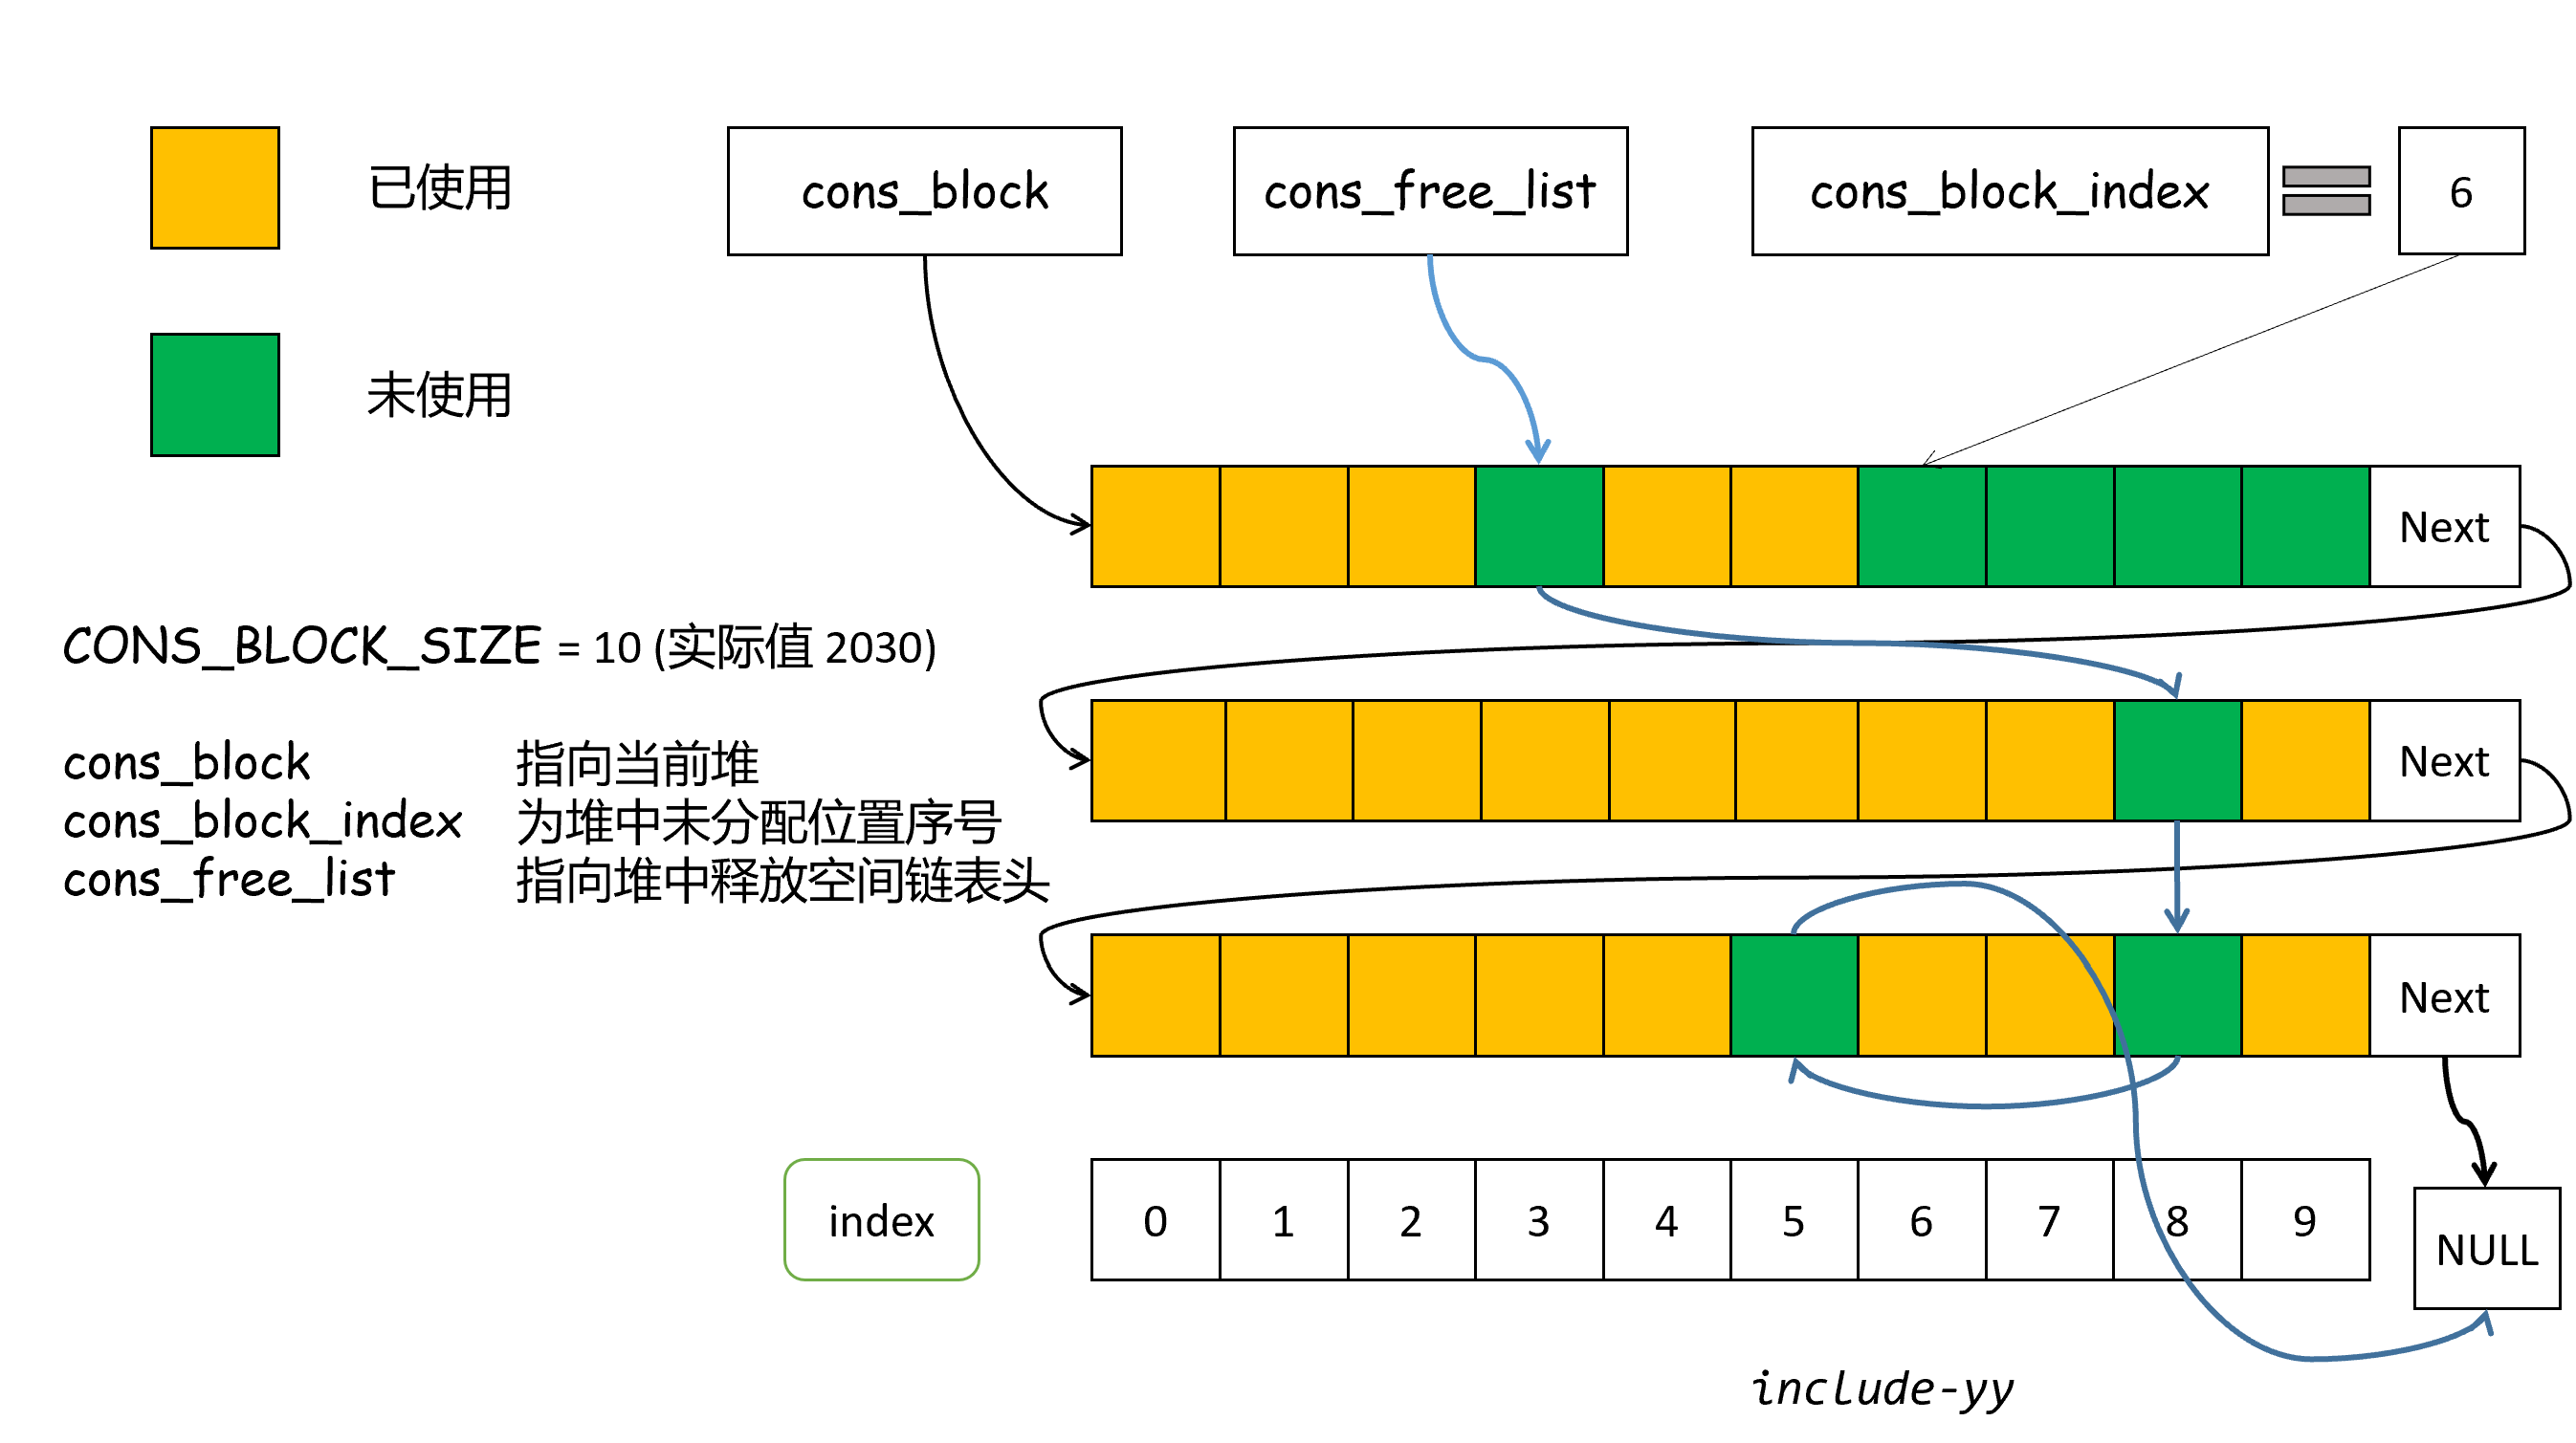
Elisp 中 CONS 的分配算法位于 alloc.c 中,简单来说 CONS 位于不同的 CONS block 中,每个 CONS block 是 32KB 字节对齐,理论计算最多可以容纳 2048 个 16 字节 CONS,但是 CONS block 还需要保存 GC bitmark 信息,最多允许 2030 个 CONS。Elisp 使用一个叫做 cons_free_list 的链表管理空闲 cons,这也是 Lisp_Cons 中 chain 成员的作用,它指向下一个空闲的 CONS 直到空指针。
当 cons_free_list 不为空链表时,新分配的 CONS 从链表中获取;当 cons_free_list 为空时,新分配的 CONS 从 CONS block 中获取,若当前 CONS block 耗尽则分配新的 CONS block。我在大概三年前画过 symbol 内存管理的示意图,现在一看和 CONS 挺相似的,改改就可以拿过来用了:
当 cons_free_list 中存在大量碎片 CONS,且各 CONS 分布于不同的 CONS block 中时,我们创建的 plist/alist 在查找时会受到很大的 cache miss 影响。虽然 Elisp 的垃圾回收很 low,甚至没有碎片整理,我在实际测试时发现日常使用中 cons_free_list 中 CONS 的碎片化并没有我想象的那么严重。换言之,缓存未命中并不是影响 plist/alist 性能差距的主要因素。
如果我们想要完全避免 CONS 碎片化的影响可以考虑使用一整个 CONS block 中的 CONS 来构建 alist/plist 并测试,这 仅仅 在 Elisp 层面难以做到,但通过编写 Emacs C 源代码可以解决。下面我会介绍避免缓存未命中的方法,这需要对 Fcons 的工作原理有些简单了解。
2025-06-02 15:42 #16 by cireu
猜测一下:plist 更长,所以需要的 pointer chasing 更多,比如把 list 拆成 pair 的表示法
(:a 1 :b 2 :c 3) => (:a . (1 . (:b . (2 . (:c . (3 . nil))))))

((a . 1) (b . 2) (c . 3)) => ((a . 1) . ((b . 2) . ((c . 3) . nil)))
alist 访问到一个 key-value pair, 直接取 pair 的 cdr 就可以访问 value, plist 访问到 key 还要取 cdr 的 car 才能访问到 value.
本文也不是什么剧情跌宕起伏的小说,所以就像我在本文开头那样我就直说了,导致 alist/plist 性能差异的主要原因就是 pointer chasing,只不过 @cireu 的后半段并不正确。
pointer 是指针,chase(chasing) 是追逐,pointer chasing 合起来可以翻译成指针追逐。所谓指针追逐指的是一种内存访问模式:连续访问内存且每次访问的地址都由前一次访问获得的数据决定。简单来说,就是通过一个指针找到一个数据,然后这个数据又包含了下一个指针,再通过这个新指针找到下一个数据,以此类推,形成一个串联的、依赖性的加载链。
pointer chasing 这一模式的典型案例就是对单链表的遍历,这也正是本文讨论的对 alist/plist 的查找。那么,pointer chasing 有什么特点呢?
- 串行依赖(Serial Dependence)。后续的内存访问必须等到前一次访问的结果才能确定下一个要访问的地址。这意味着内存访问很难并行化。
- 不规则的内存访问。链表等结构的地址通常是跳跃和不连续的,如果链表单元的局部性不好(比如 CONS 跨 CONS block 链接),会导致较低的缓存命中率。
根据这两个特点,pointer chasing 会导致程序 难以并行 和 对延迟敏感 。对于 alist/plist 的查找,如果键比较开销远小于列表 CDR 操作开销,那么程序的性能将取决于内存访问延迟。
下面,让我们试着排除缓存命中对程序的影响。
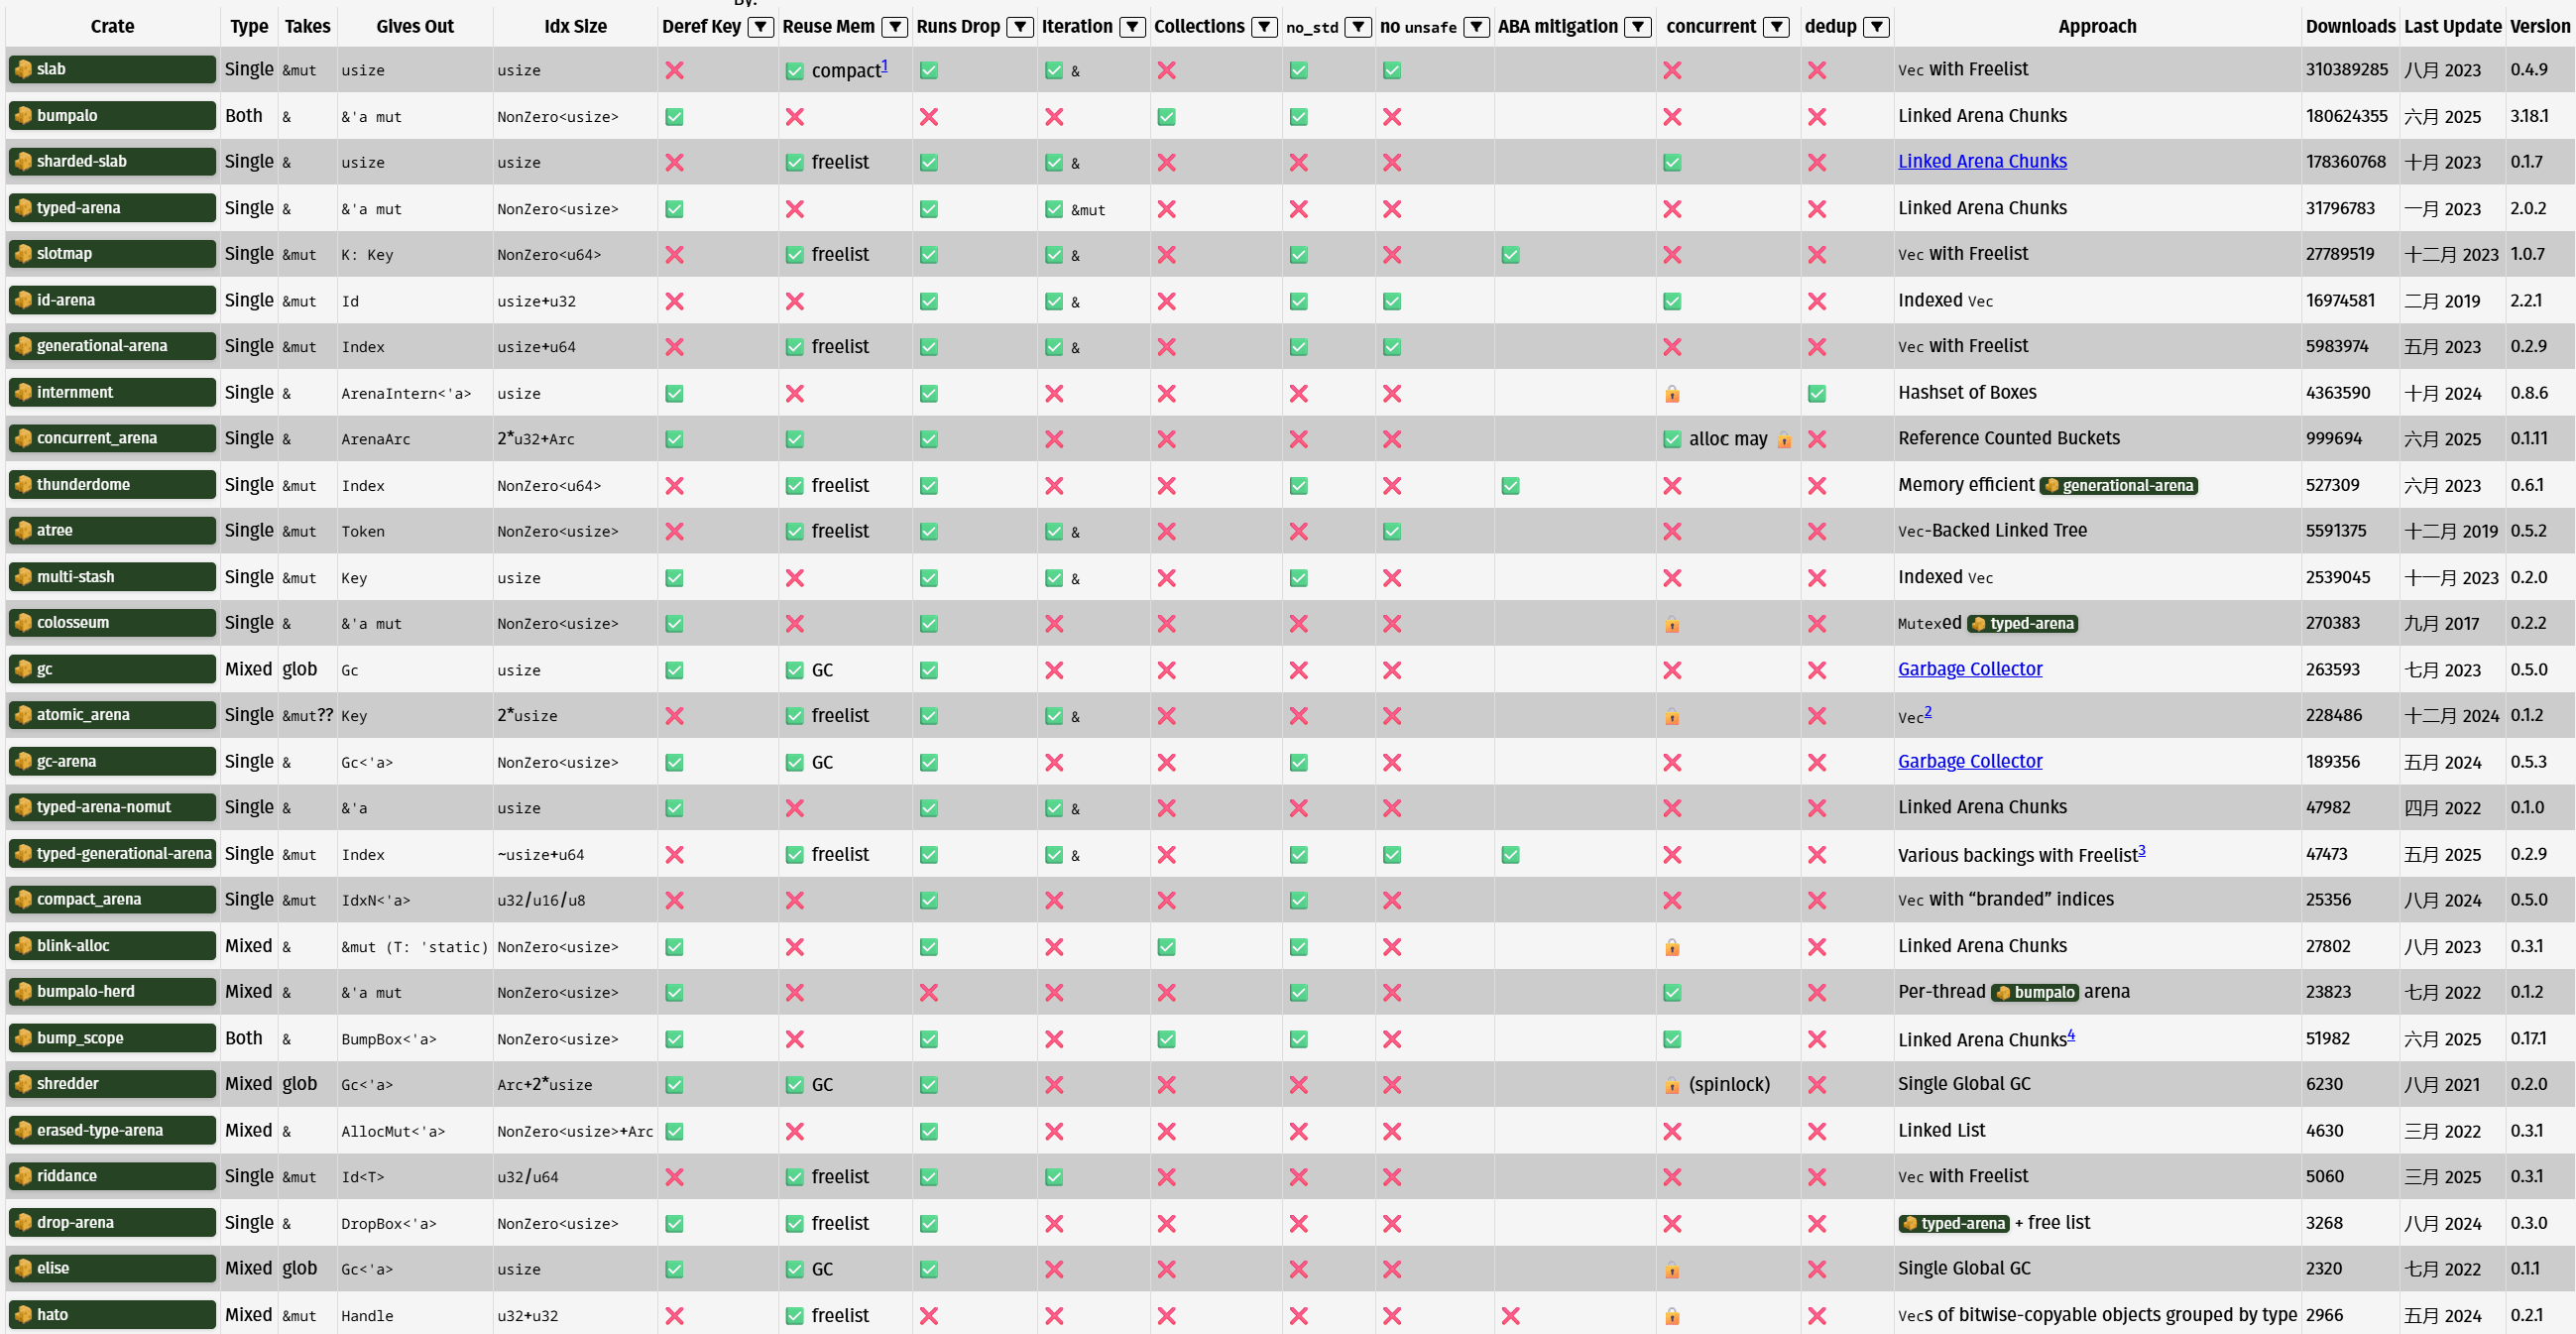
既然链表结构数据容易缓存未命中,那我把所有的链表节点放到一个小于 CPU L1-cache 的内存块里面不就行了?这在 Rust 里面也叫 arena(竞技场),有一堆 crate 实现了 arena:
对于现在(2025)的一般的桌面 CPU 来说,L1-cache 一般在 32KB 到 64KB 之间,L1 和 L2 一般是单个核心独占,而 L3 是所有核心共享。以我使用过的几款机器中的 CPU 来说,它们的 cache 大小如下所示:
| CPU 型号 | 核心数 | L1(总共/单核) | L2(总共/单核) | L3 |
| 6900HX | 8 | 512KB / 64KB | 4MB / 512KB | 16MB |
| 7640HS | 6 | 384KB / 64KB | 6MB / 1MB | 16MB |
| i5-11300H | 4 | 192KB / 48KB | 5MB / 1280KB | 8MB |
| ultra7-255H | 6(P)+8(E)+2(LPE) | 1MB / 64KB | (P)18MB/3MB, (E/LPE)2MB/X | 24MB |
单个 CONS block 的大小是 32KB,是能够全部放入 L1-cache 的。现在的问题就是如何保证所有用到的 CONS 都在 CONS block 上。下面是 Fcons 的实现:
DEFUN ("cons", Fcons, Scons, 2, 2, 0,
       doc: /* Create a new cons, give it CAR and CDR as components, and return it.  */)
  (Lisp_Object car, Lisp_Object cdr)
{
  register Lisp_Object val;

  if (cons_free_list)
    {
      ASAN_UNPOISON_CONS (cons_free_list);
      XSETCONS (val, cons_free_list);
      cons_free_list = cons_free_list->u.s.u.chain;
    }
  else
    {
      if (cons_block_index == CONS_BLOCK_SIZE)
	{
	  struct cons_block *new
	    = lisp_align_malloc (sizeof *new, MEM_TYPE_CONS);
	  memset (new->gcmarkbits, 0, sizeof new->gcmarkbits);
	  ASAN_POISON_CONS_BLOCK (new);
	  new->next = cons_block;
	  cons_block = new;
	  cons_block_index = 0;
	}
      ASAN_UNPOISON_CONS (&cons_block->conses[cons_block_index]);
      XSETCONS (val, &cons_block->conses[cons_block_index]);
      cons_block_index++;
    }

  XSETCAR (val, car);
  XSETCDR (val, cdr);
  eassert (!XCONS_MARKED_P (XCONS (val)));
  consing_until_gc -= sizeof (struct Lisp_Cons);
  cons_cells_consed++;
  return val;
}
从实现来看,我们只需要让 cons_block_index 暂时为 Qnil ,然后耗尽当前 CONS block 后分配一整个 CONS block 的内容就可以了,这可以通过下面的代码来实现:
DEFUN ("yy-cons-bulk", Fyy_cons_bulk, Syy_cons_bulk, 0, 0, 0,
       doc: /* Create a CONS_BLOCK_SIZE vector containing a whole cons_block's conses.
	       Return Cons of the last cons_block's rest number of cons and the vector.  */)
  (void)
{
  Lisp_Object val;
  Lisp_Object vec;
  EMACS_INT cnt = 0;

  struct Lisp_Cons *copy = cons_free_list;
  cons_free_list = NULL;
  val = Qnil;
  while (cons_block_index < CONS_BLOCK_SIZE)
    {
      val = Fcons (Qnil, val);
      cnt = cnt + 1;
    }
  vec = make_vector (CONS_BLOCK_SIZE, Qnil);
  for (EMACS_INT i = 0; i < CONS_BLOCK_SIZE; i++)
    {
      val = Fcons (Qt, Qt);
      ASET(vec, i, val);
    }
  cons_free_list = copy;
  return Fcons(make_fixnum(cnt), vec);
}

// add defsubr in alloc.c's syms_of_alloc:
void syms_of_alloc(void)
{
  ...;
  defsubr (&Syy_cons_bulk);
  ...;
}
yy-cons-bulk 会分配一个 CONS block 上的所有 CONS,并放在一个 VECTOR 里面,加上上一个 CONS block 中的空闲 cons 个数返回。由于这些 CONS 在内存中是连续的,它们的相邻地址之差为 16 字节,配合下面的代码可以检验所有 CONS 的连续性:
DEFUN ("yy-ptr", Fyy_ptr, Syy_ptr, 1, 1, 0,
       doc: /* yy's ptr function, get pointer value >> 3 */)
  (Lisp_Object obj)
{
  if (!CONSP (obj))
    return Qnil;
  return make_ufixnum(XLI(obj) >> 3);
}
// Remember to add defsubr (&Syy_ptr)(defun yy-bulk-test ()
(let* ((a (cdr (yy-cons-bulk)))
(len (length a))
(i 0))
(should (= len 2030))
(should (zerop (% (yy-ptr (aref a 0)) (expt 2 12))))
(while (< (incf i) len)
(should (= 2 (- (yy-ptr (aref a i))
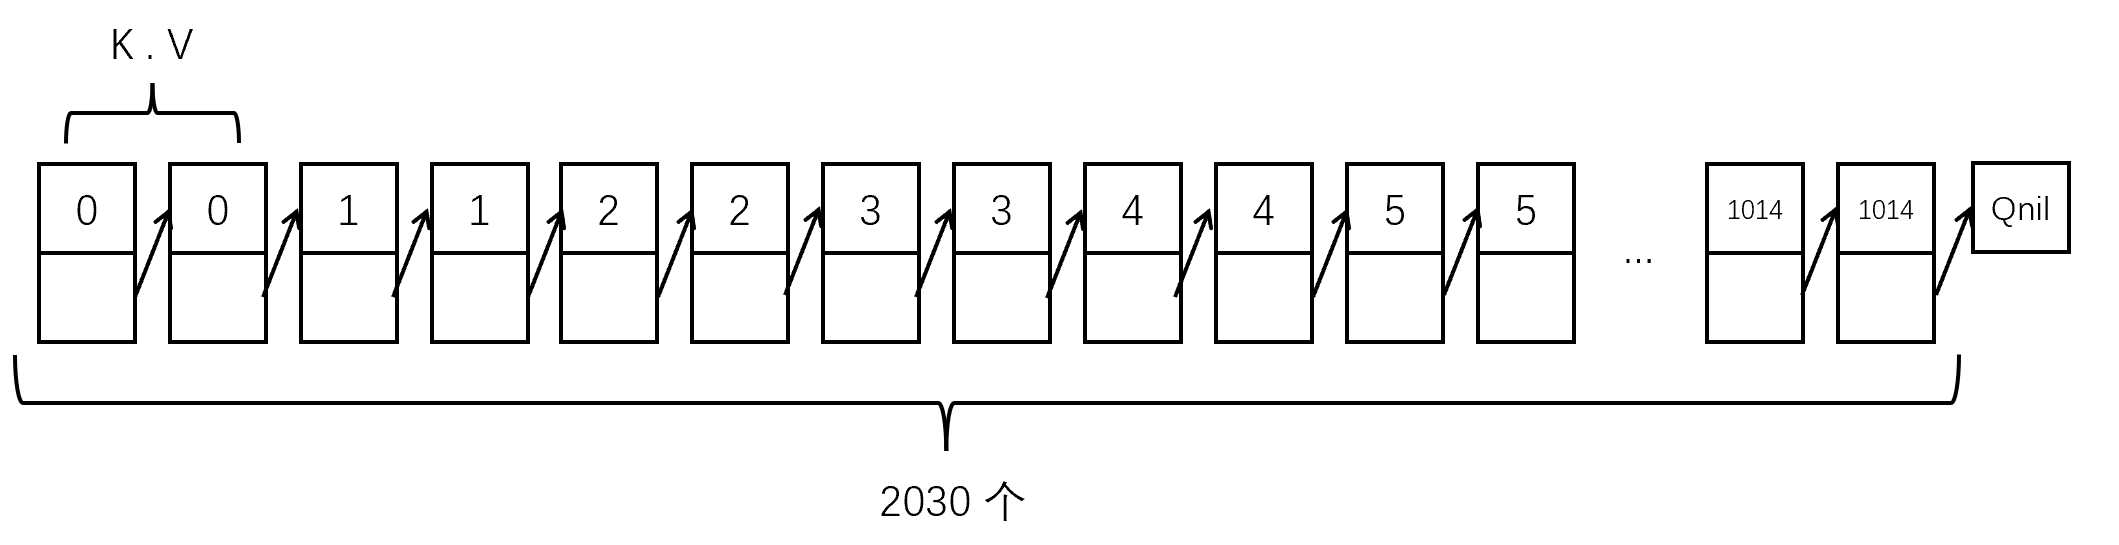
(yy-ptr (aref a (1- i)))))))))在这个 VECTOR 上创建 plist 的示意图如下:
至于 alist,如果使用 (push (cons k v) ls) 的方式在单个空的 CONS block 中创建,结构如下(键值对 CONS 和列表主体 CONS 是相邻交错的):
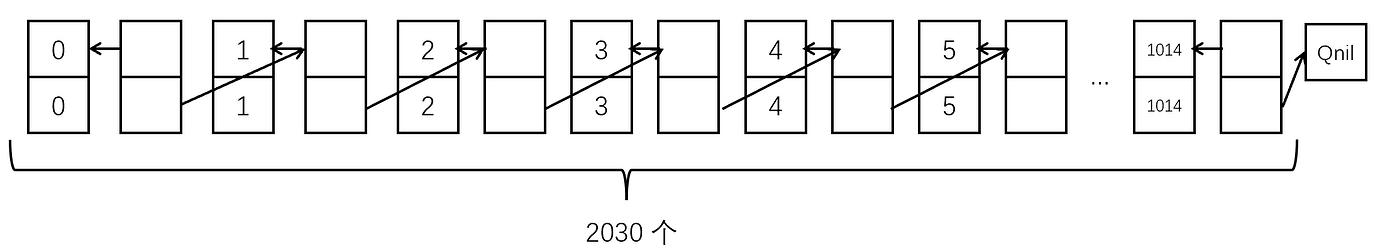
除了这一种 alist 外,我们还可以把 kv CONS 放在前 1015 个,把列表 CONS 放在后 1015 个(或者倒过来),下面是用来生成单个 CONS block 内的 plist/alist 的函数( *-alist1 对应交错分配, *-alist2 对应前 kv 后列表, *-alist3 对应前列表后 kv):
make-plist-alist-1-2-3
(defun make-test-plist ()
  (let ((pv (cdr (yy-cons-bulk))))
    (cl-assert (= (length pv) 2030))
    (cl-do ((i 0 (1+ i)))
	((> i 2028))
      (setcar (aref pv i) (/ i 2))
      (setcdr (aref pv i) (aref pv (1+ i))))
    (setcar (aref pv 2029) 1014)
    (setcdr (aref pv 2029) nil)
    (let ((pl (aref pv 0))
	  (i 0))
      (cl-mapl (lambda (x)
		 (cl-assert (eq x (aref pv i)))
		 (cl-incf i))
	       pl)
      (dotimes (i 1015)
	(cl-assert (eq (plist-get pl i) i)))
      pl)))

(defun make-test-alist1 ()
  (let ((av (cdr (yy-cons-bulk))))
    (cl-assert (= (length av) 2030))
    (cl-do ((i 0 (+ i 2))
	    (j 1 (+ j 2)))
	((= i 2028))
      (setcar (aref av i) (/ i 2))
      (setcdr (aref av i) (/ i 2))
      (setcar (aref av j) (aref av i))
      (setcdr (aref av j) (aref av (+ j 2))))
    (setcar (aref av 2028) 1014)
    (setcdr (aref av 2028) 1014)
    (setcar (aref av 2029) (aref av 2028))
    (setcdr (aref av 2029) nil)
    (let* ((al (aref av 1))
	   (k 0))
      (dotimes (i 1015)
	(cl-assert (eq (alist-get i al) i)))
      (cl-mapl (lambda (x)
		 (cl-assert (eq x (aref av (1+ (* 2 k)))))
		 (cl-assert (eq (car x) (aref av (* k 2))))
		 (cl-incf k))
	       al)
      al)))

(defun make-test-alist2 ()
  (let ((av (cdr (yy-cons-bulk))))
    (cl-assert (= (length av) 2030))
    (cl-do ((i 0 (+ i 1)))
	((> i 1014))
      (setcar (aref av i) i)
      (setcdr (aref av i) i))
    (cl-do ((i 1015 (+ i 1)))
	((> i 2028))
      (setcar (aref av i) (aref av (- i 1015)))
      (setcdr (aref av i) (aref av (1+ i))))
    (setcar (aref av 2029) (aref av 1014))
    (setcdr (aref av 2029) nil)
    (let* ((al (aref av 1015))
	   (k 0))
      (dotimes (i 1015)
	(cl-assert (eq (alist-get i al) i)))
      (cl-mapl (lambda (x)
		 (cl-assert (eq x (aref av (+ k 1015))))
		 (cl-assert (eq (car x) (aref av k)))
		 (cl-incf k))
	       al)
      al)))

(defun make-test-alist3 ()
  (let ((av (cdr (yy-cons-bulk))))
    (cl-assert (= (length av) 2030))
    (cl-do ((i 1015 (+ i 1)))
	((> i 2029))
      (setcar (aref av i) (- i 1015))
      (setcdr (aref av i) (- i 1015)))
    (cl-do ((i 0 (+ i 1)))
	((> i 1014))
      (setcar (aref av i) (aref av (+ i 1015)))
      (setcdr (aref av i) (aref av (1+ i))))
    (setcar (aref av 1014) (aref av 2029))
    (setcdr (aref av 1014) nil)
    (let* ((al (aref av 0))
	   (k 0))
      (dotimes (i 1015)
	(cl-assert (eq (alist-get i al) i)))
      (cl-mapl (lambda (x)
		 (cl-assert (eq x (aref av k)))
		 (cl-assert (eq (car x) (aref av (+ k 1015))))
		 (cl-incf k))
	       al)
      al)))
下面是测试代码和新的测试结果:
test
(progn
  (defun test-p (key plist rep)
    (declare (ftype (function (t list fixnum) float)))
    (let ((t1 (float-time)))
      (dotimes (_ rep)
	(plist-get plist key))
      (* (/ (- (float-time) t1) rep) (expt 10 9))))

  (defun test-a (key alist rep)
    (declare (ftype (function (t list fixnum) float)))
    (let ((t1 (float-time)))
      (dotimes (_ rep)
	(alist-get key alist))
      (* (/ (- (float-time) t1) rep) (expt 10 9))))
  (dlet ((native-comp-speed 3))
    (native-compile 'test-p)
    (native-compile 'test-a)))

(setq pl (make-test-plist))
(setq al1 (make-test-alist1))
(setq al2 (make-test-alist2))
(setq al3 (make-test-alist3))

(when nil
  (setq a
	(let ((res))
	  (dotimes (i 1015)
	    (push (test-p i pl 10000) res))
	  (reverse res)))
  (setq b
	(let ((res))
	  (dotimes (i 1015)
	    (push (test-a i al1 10000) res))
	  (reverse res)))
  (setq c
	(let ((res))
	  (dotimes (i 1015)
	    (push (test-a i al2 10000) res))
	  (reverse res)))
  (setq d
	(let ((res))
	  (dotimes (i 1015)
	    (push (test-a i al3 10000) res))
	  (reverse res)))
  )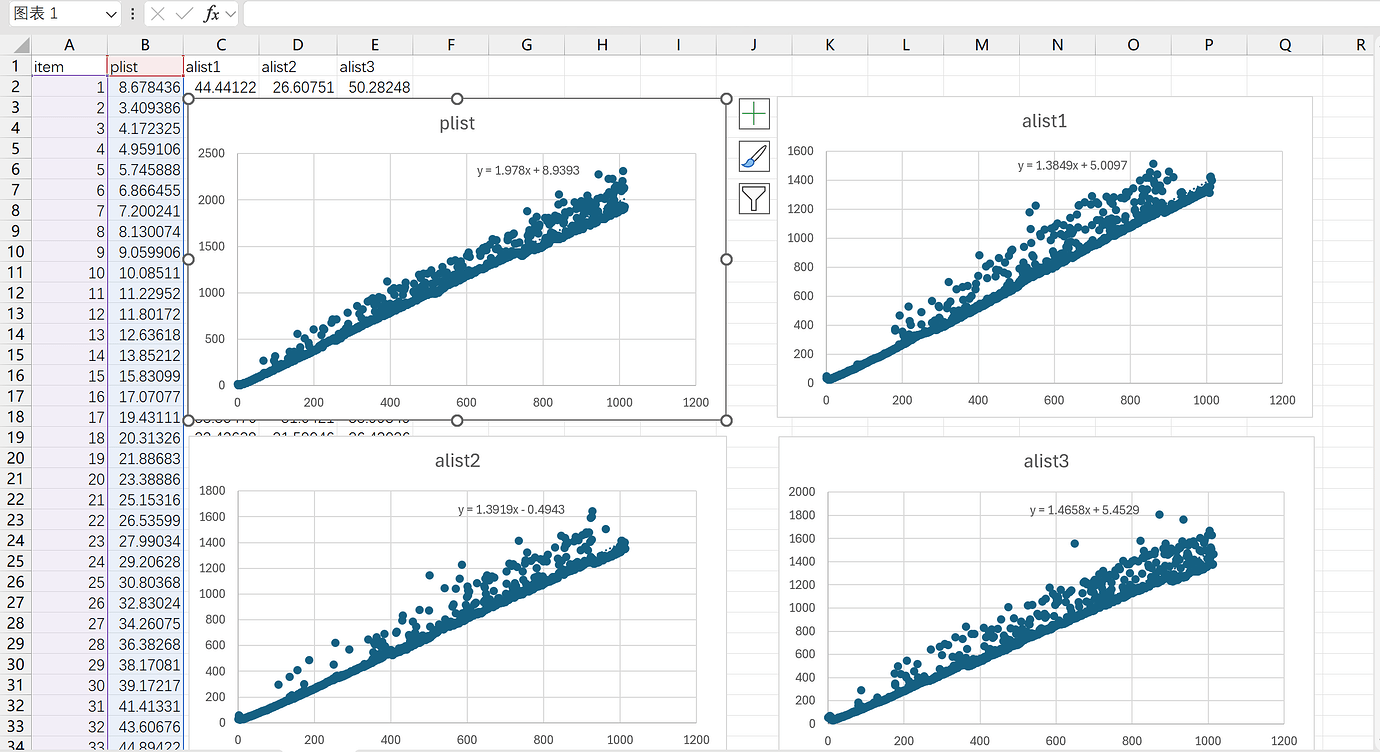
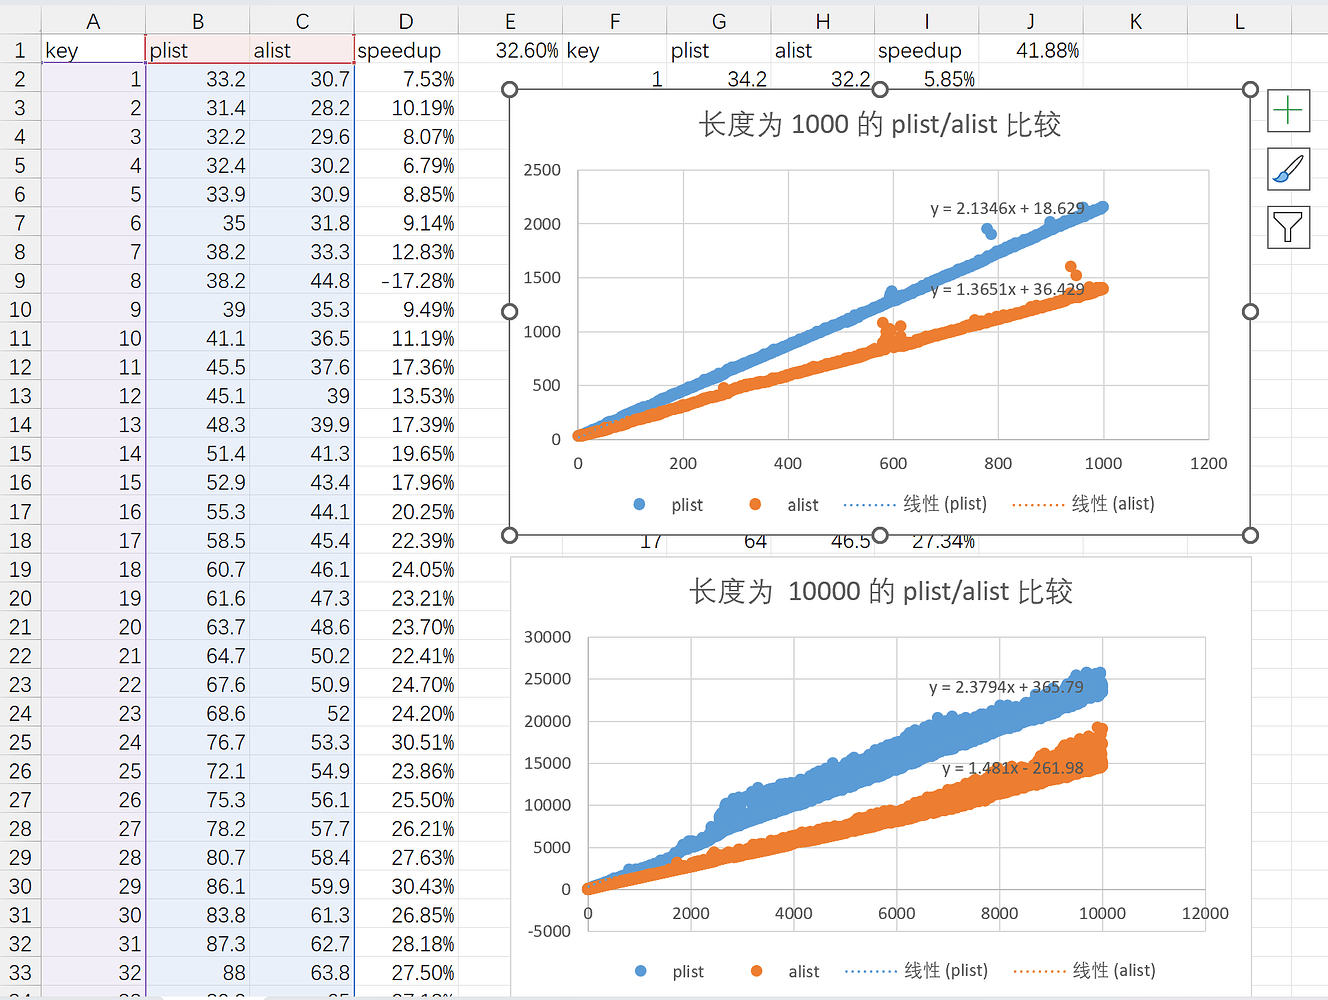
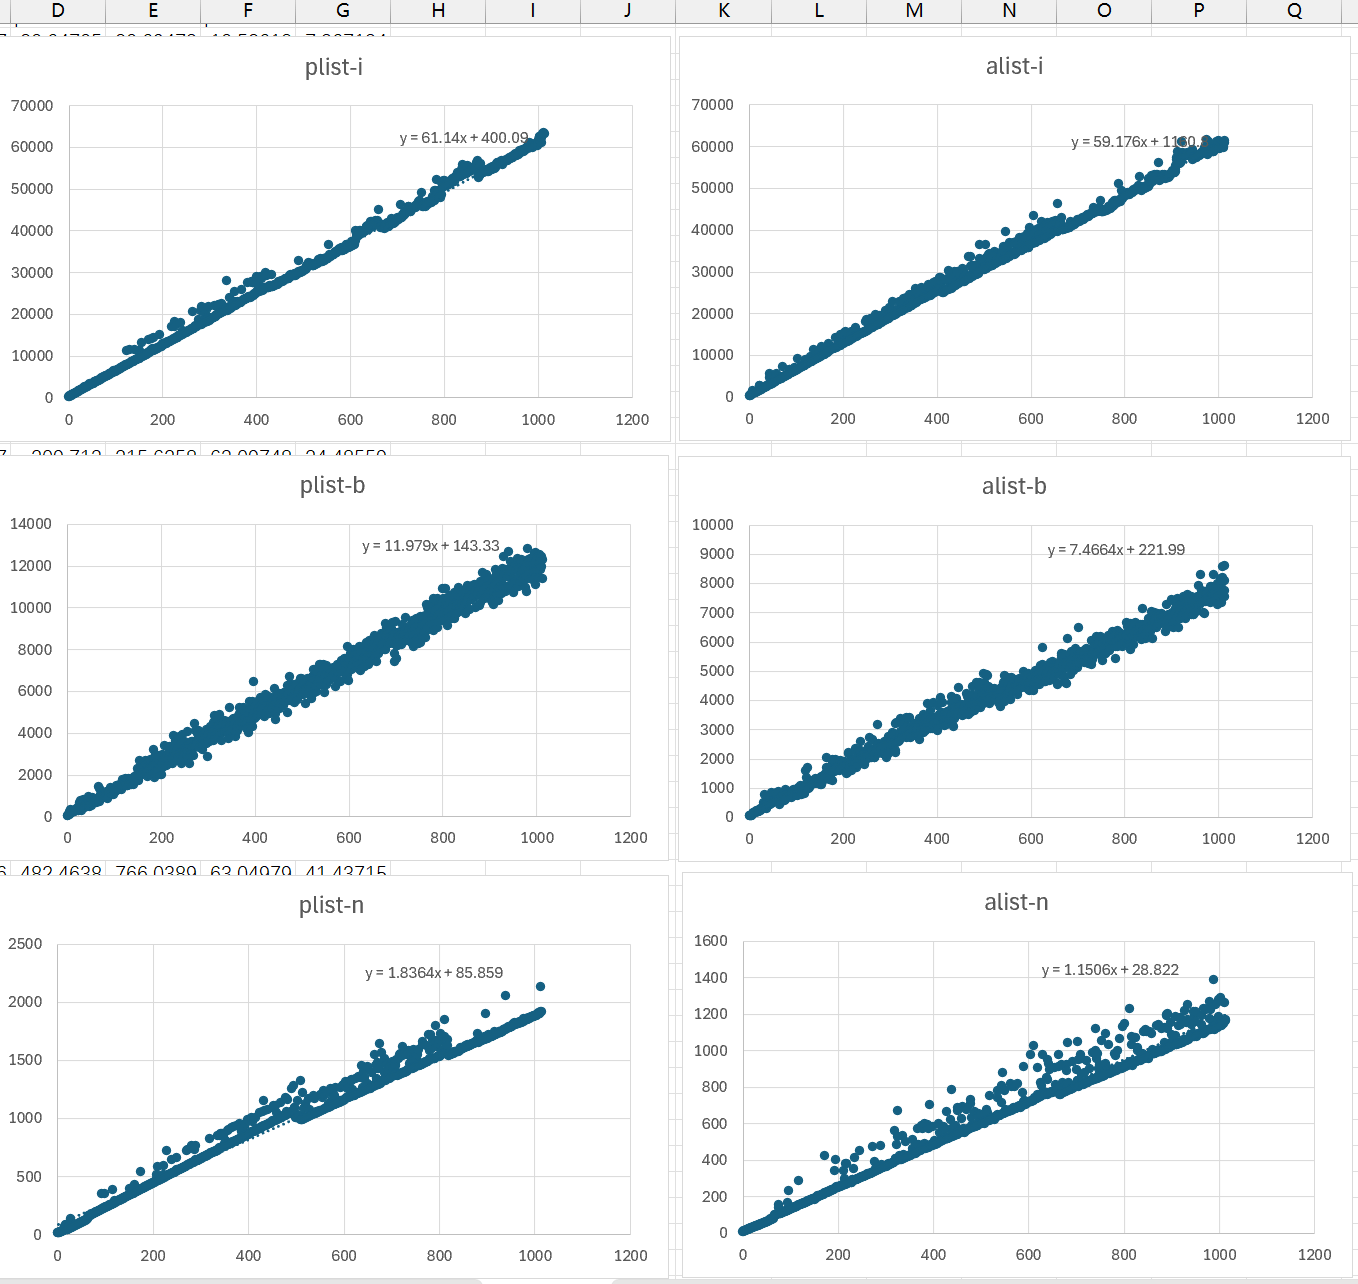
如你所见,即使“消除”了 cache miss, plist-get 和 alist-get 的性能差距依旧明显。 plist-get 和 alist-get 也仍旧存在除算法之外的差异:
plist-get是 subr,而alist-get是普通的 Elisp 函数plist-get使用了FOR_EACH_TAIL_SAFE,而alist-get(间接)使用FOR_EACH_TAIL
为了消除一些可能的额外调用和检查开销,我重新实现了 my-plist-get 和 my-alist-get :
DEFUN ("my-plist-get", Fmy_plist_get, Smy_plist_get, 2, 2, 0,
       doc: /* plist_get, without any check. */)
  (Lisp_Object plist, Lisp_Object prop)
{
  for(; !NILP (plist); plist = XCDR (XCDR (plist)))
    {
      if (EQ (XCAR (plist), prop))
        return XCAR (XCDR (plist));
    }
  return Qnil;
}
DEFUN ("my-alist-get", Fmy_alist_get, Smy_alist_get, 2, 2, 0,
       doc: /* alist_get, witout any check. */)
  (Lisp_Object key, Lisp_Object alist)
{
  for (; ! NILP (alist); alist = XCDR (alist))
    if (EQ (XCAR (XCAR (alist)), key))
      return XCDR (XCAR (alist));
  return Qnil;
}
然后使用上一节的测试代码重新进行了测试(把 plist/alist-get 替换为 my-plist/alist-get ):
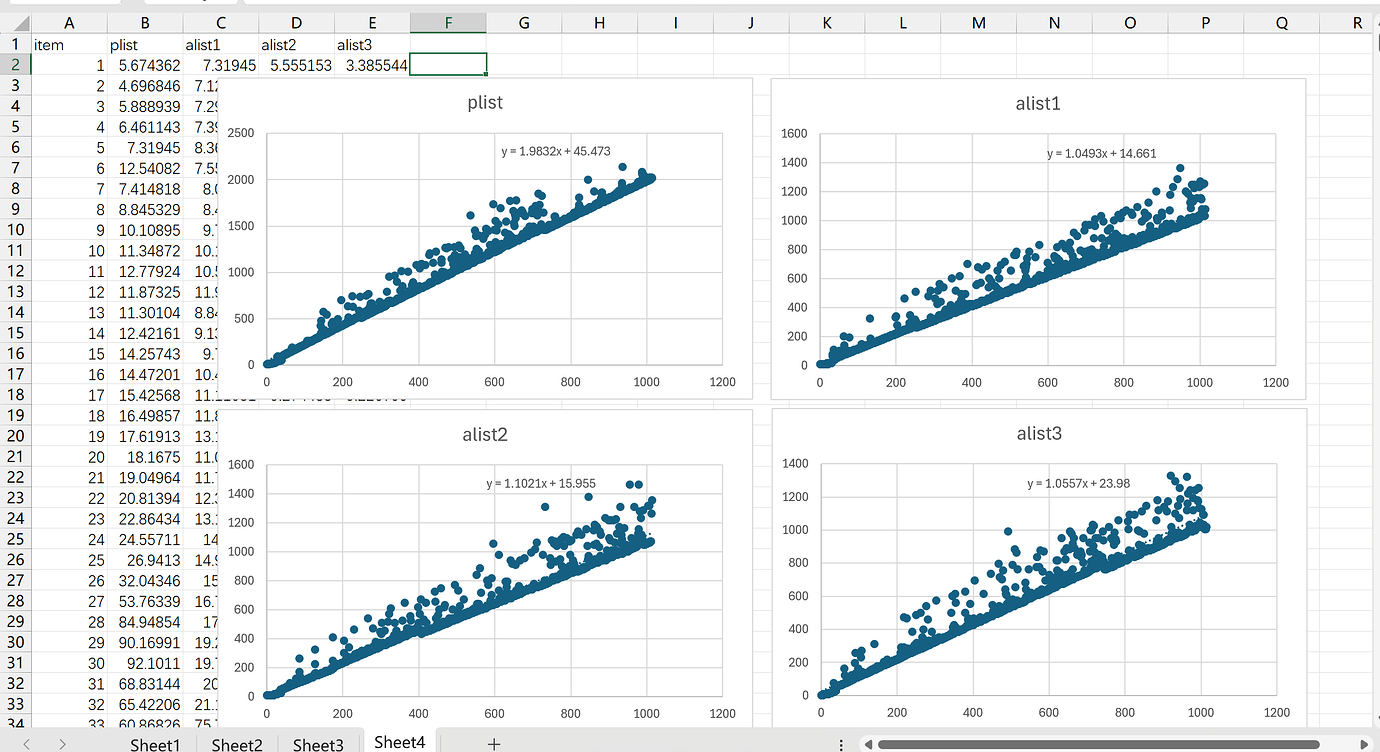
可见,在去掉了几乎所有检查的情况下,两者的拟合曲线的斜率几乎是 1:2 的关系。
下面是 objdump 的输出结果:
objdump
00000000000015b0 <Fmy_plist_get>:
    15b0:	53                   	push   %rbx
    15b1:	49 89 d1             	mov    %rdx,%r9
    15b4:	48 85 c9             	test   %rcx,%rcx
    15b7:	0f 84 bb 00 00 00    	je     1678 <Fmy_plist_get+0xc8>
    15bd:	48 8b 05 00 00 00 00 	mov    0x0(%rip),%rax        # 15c4 <Fmy_plist_get+0x14>
    15c4:	44 0f b6 90 10 11 00 	movzbl 0x1110(%rax),%r10d
    15cb:	00
    15cc:	eb 20                	jmp    15ee <Fmy_plist_get+0x3e>
    15ce:	66 90                	xchg   %ax,%ax
    15d0:	49 8b 50 08          	mov    0x8(%r8),%rdx
    15d4:	4c 8d 42 fd          	lea    -0x3(%rdx),%r8
    15d8:	48 39 c1             	cmp    %rax,%rcx
    15db:	0f 84 8b 00 00 00    	je     166c <Fmy_plist_get+0xbc>
    15e1:	49 8b 48 08          	mov    0x8(%r8),%rcx
    15e5:	48 85 c9             	test   %rcx,%rcx
    15e8:	0f 84 8a 00 00 00    	je     1678 <Fmy_plist_get+0xc8>
    15ee:	48 8b 51 fd          	mov    -0x3(%rcx),%rdx
    15f2:	4c 8d 41 fd          	lea    -0x3(%rcx),%r8
    15f6:	4c 89 c9             	mov    %r9,%rcx
    15f9:	48 89 d0             	mov    %rdx,%rax
    15fc:	45 84 d2             	test   %r10b,%r10b
    15ff:	74 cf                	je     15d0 <Fmy_plist_get+0x20>
    1601:	41 8d 41 fb          	lea    -0x5(%r9),%eax
    1605:	a8 07                	test   $0x7,%al
    1607:	75 1d                	jne    1626 <Fmy_plist_get+0x76>
    1609:	48 b8 00 00 00 3f 00 	movabs $0x400000003f000000,%rax
    1610:	00 00 40
    1613:	49 23 41 fb          	and    -0x5(%r9),%rax
    1617:	49 bb 00 00 00 06 00 	movabs $0x4000000006000000,%r11
    161e:	00 00 40
    1621:	4c 39 d8             	cmp    %r11,%rax
    1624:	74 5a                	je     1680 <Fmy_plist_get+0xd0>
    1626:	44 8d 5a fb          	lea    -0x5(%rdx),%r11d
    162a:	48 89 d0             	mov    %rdx,%rax
    162d:	41 83 e3 07          	and    $0x7,%r11d
    1631:	75 9d                	jne    15d0 <Fmy_plist_get+0x20>
    1633:	49 bb 00 00 00 3f 00 	movabs $0x400000003f000000,%r11
    163a:	00 00 40
    163d:	4c 23 5a fb          	and    -0x5(%rdx),%r11
    1641:	4c 89 da             	mov    %r11,%rdx
    1644:	49 bb 00 00 00 06 00 	movabs $0x4000000006000000,%r11
    164b:	00 00 40
    164e:	4c 39 da             	cmp    %r11,%rdx
    1651:	0f 85 79 ff ff ff    	jne    15d0 <Fmy_plist_get+0x20>
    1657:	49 8b 50 08          	mov    0x8(%r8),%rdx
    165b:	48 8b 40 03          	mov    0x3(%rax),%rax
    165f:	4c 8d 42 fd          	lea    -0x3(%rdx),%r8
    1663:	48 39 c1             	cmp    %rax,%rcx
    1666:	0f 85 75 ff ff ff    	jne    15e1 <Fmy_plist_get+0x31>
    166c:	48 8b 42 fd          	mov    -0x3(%rdx),%rax
    1670:	5b                   	pop    %rbx
    1671:	c3                   	ret
    1672:	66 0f 1f 44 00 00    	nopw   0x0(%rax,%rax,1)
    1678:	31 c0                	xor    %eax,%eax
    167a:	5b                   	pop    %rbx
    167b:	c3                   	ret
    167c:	0f 1f 40 00          	nopl   0x0(%rax)
    1680:	44 8d 5a fb          	lea    -0x5(%rdx),%r11d
    1684:	49 8b 49 03          	mov    0x3(%r9),%rcx
    1688:	48 89 d0             	mov    %rdx,%rax
    168b:	41 83 e3 07          	and    $0x7,%r11d
    168f:	0f 85 3b ff ff ff    	jne    15d0 <Fmy_plist_get+0x20>
    1695:	eb 9c                	jmp    1633 <Fmy_plist_get+0x83>
    1697:	66 0f 1f 84 00 00 00 	nopw   0x0(%rax,%rax,1)
    169e:	00 00

00000000000012f0 <Fmy_alist_get>:
    12f0:	56                   	push   %rsi
    12f1:	53                   	push   %rbx
    12f2:	49 89 c9             	mov    %rcx,%r9
    12f5:	48 85 d2             	test   %rdx,%rdx
    12f8:	0f 84 b2 00 00 00    	je     13b0 <Fmy_alist_get+0xc0>
    12fe:	48 8b 05 00 00 00 00 	mov    0x0(%rip),%rax        # 1305 <Fmy_alist_get+0x15>
    1305:	44 0f b6 90 10 11 00 	movzbl 0x1110(%rax),%r10d
    130c:	00
    130d:	eb 17                	jmp    1326 <Fmy_alist_get+0x36>
    130f:	90                   	nop
    1310:	48 39 c1             	cmp    %rax,%rcx
    1313:	0f 84 89 00 00 00    	je     13a2 <Fmy_alist_get+0xb2>
    1319:	49 8b 50 08          	mov    0x8(%r8),%rdx
    131d:	48 85 d2             	test   %rdx,%rdx
    1320:	0f 84 8a 00 00 00    	je     13b0 <Fmy_alist_get+0xc0>
    1326:	48 8b 42 fd          	mov    -0x3(%rdx),%rax
    132a:	4c 8d 42 fd          	lea    -0x3(%rdx),%r8
    132e:	4c 89 c9             	mov    %r9,%rcx
    1331:	48 8b 50 fd          	mov    -0x3(%rax),%rdx
    1335:	4c 8d 58 fd          	lea    -0x3(%rax),%r11
    1339:	48 89 d0             	mov    %rdx,%rax
    133c:	45 84 d2             	test   %r10b,%r10b
    133f:	74 cf                	je     1310 <Fmy_alist_get+0x20>
    1341:	41 8d 41 fb          	lea    -0x5(%r9),%eax
    1345:	a8 07                	test   $0x7,%al
    1347:	75 1d                	jne    1366 <Fmy_alist_get+0x76>
    1349:	48 b8 00 00 00 3f 00 	movabs $0x400000003f000000,%rax
    1350:	00 00 40
    1353:	49 23 41 fb          	and    -0x5(%r9),%rax
    1357:	48 bb 00 00 00 06 00 	movabs $0x4000000006000000,%rbx
    135e:	00 00 40
    1361:	48 39 d8             	cmp    %rbx,%rax
    1364:	74 52                	je     13b8 <Fmy_alist_get+0xc8>
    1366:	8d 5a fb             	lea    -0x5(%rdx),%ebx
    1369:	48 89 d0             	mov    %rdx,%rax
    136c:	83 e3 07             	and    $0x7,%ebx
    136f:	75 9f                	jne    1310 <Fmy_alist_get+0x20>
    1371:	48 bb 00 00 00 3f 00 	movabs $0x400000003f000000,%rbx
    1378:	00 00 40
    137b:	48 23 5a fb          	and    -0x5(%rdx),%rbx
    137f:	48 89 da             	mov    %rbx,%rdx
    1382:	48 bb 00 00 00 06 00 	movabs $0x4000000006000000,%rbx
    1389:	00 00 40
    138c:	48 39 da             	cmp    %rbx,%rdx
    138f:	0f 85 7b ff ff ff    	jne    1310 <Fmy_alist_get+0x20>
    1395:	48 8b 40 03          	mov    0x3(%rax),%rax
    1399:	48 39 c1             	cmp    %rax,%rcx
    139c:	0f 85 77 ff ff ff    	jne    1319 <Fmy_alist_get+0x29>
    13a2:	49 8b 43 08          	mov    0x8(%r11),%rax
    13a6:	5b                   	pop    %rbx
    13a7:	5e                   	pop    %rsi
    13a8:	c3                   	ret
    13a9:	0f 1f 80 00 00 00 00 	nopl   0x0(%rax)
    13b0:	31 c0                	xor    %eax,%eax
    13b2:	5b                   	pop    %rbx
    13b3:	5e                   	pop    %rsi
    13b4:	c3                   	ret
    13b5:	0f 1f 00             	nopl   (%rax)
    13b8:	8d 5a fb             	lea    -0x5(%rdx),%ebx
    13bb:	49 8b 49 03          	mov    0x3(%r9),%rcx
    13bf:	48 89 d0             	mov    %rdx,%rax
    13c2:	83 e3 07             	and    $0x7,%ebx
    13c5:	0f 85 45 ff ff ff    	jne    1310 <Fmy_alist_get+0x20>
    13cb:	eb a4                	jmp    1371 <Fmy_alist_get+0x81>
    13cd:	0f 1f 00             	nopl   (%rax)
我手动反汇编了一下,去掉了 EQ 比较的 SYMBOL_WITH_POS_P 相关部分:
Fmy_alist_get (rdx /* alist */, rcx /* key */)
{
  if (rdx == Qnil)             // 12f5: test   %rdx,%rdx
    {                          // 12f8: je     13b0 <Fmy_alist_get+0xc0>
      eax = 0;                 // 13b0: xor    %eax,%eax
      return;                  // 13b4: ret
    }
  for (;;)
    {
      rax = mov_xcar(rdx);     // 1326: mov    -0x3(%rdx),%rax
      r8  = lea_xcons(rdx);    // 132a: lea    -0x3(%rdx),%r8
      rcx = r9;                // 132e: mov    %r9,%rcx
      rdx = mov_xcar(rax);     // 1331: mov    -0x3(%rax),%rdx
      r11 = lea_xcons(rax);    // 1335: lea    -0x3(%rax),%r11
      rax = rdx;               // 1339: mov    %rdx,%rax
      if (rax == rcx)          // 1310: cmp    %rax,%rcx
	{                      // 1313: je     13a2 <Fmy_alist_get+0xb2>
	  rax = mov_cdr(r11);  // 13a2: mov    0x8(%r11),%rax
	  return;              // 13a8: ret
	}
      rdx = mov_cdr(r8);       // 1319: mov    0x8(%r8),%rdx
      if (rdx == Qnil)         // 131d: test   %rdx,%rdx
	{                      // 1320: je     13b0 <Fmy_alist_get+0xc0>
	  eax = 0;             // 13b0: xor    %eax, %eax
	  return;              // 13b4: ret
	}
    }
}Fmy_plist_get(rdx /* key */, rcx /* plist */)
{
r9 = rdx; // 15b1: mov %rdx,%r9
if (rcx == Qnil) // 15b5: test %rcx,%rcx
{ // 15b7: je 1678 <Fmy_plist_get+0xc8>
eax = 0; // 1678: xor %eax,%eax
return; // 167b: ret
}
for(;;)
{
rdx = mov_xcar(rcx); // 15ee: mov -0x3(%rcx),%rdx
r8 = lea_xcons(rcx); // 15f2: lea -0x3(%rcx),%r8
rcx = r9; // 15f6: mov %r9,%rcx
rax = rdx; // 15f9: mov %rdx,%rax
rdx = mov_cdr(r8); // 15d0: mov 0x8(%r8),%rdx
r8 = lea_xcons(rdx); // 15d4: lea -0x3(%rdx),%r8
if (rcx == rax) // 15d8: cmp %rax,%rcx
{ // 15db: je 166c <Fmy_plist_get+0xbc>
rax = mov_xcar(rdx); // 166c: mov -0x3(%rdx),%rax
return; // 1671: ret
}
rcx = mov_cdr(r8); // 15e1: mov 0x8(%r8),%rcx
if (rcx == Qnil) // 15e5: test %rcx,%rcx
{ // 15e8: je 1678 <Fmy_plist_get+0xc8>
eax = 0; // 1678: xor %eax,%eax
return; // 167b: ret
}
}
}my-alist-get 每次循环需要一次 CDR 操作,而 my-plist-get 需要两次,这与上面的斜率 1:2 是吻合的,但是具体要如何解释呢?
原本我打算在 WSL 中使用 perf 测试,但是六月六号空调罕见地漏水把我笔记本给烧了,空调师傅来检查的时候发现是因为排水管道太长加上时间有点久了弯成了 U 型,水累积在中间排不出去只能从空调内机排出来,正好滴到内机正下方的电脑上。我也只能忍痛把 Remibook 2021 换成了最新的 Redmibook 2025 pro 16,算上国补 6000 大洋,Emacs 的启动时间也从 3 秒提升 100% 来到 1.5 秒。
闲话说得有点多了,由于懒得重装 WSL 了,我直接下载了 Windows 上可用的 Intel 性能调优工具 VTune。它提供了很多测试方式,不过我用得上的只有 Hotspots 和 Microarchitecture Exploration。使用之前记得参考文档安装 sampling driver,然后以管理员身份启动 VTune。
下图是 alist 的 Hotspts 测试,测试代码不变,只是把循环次数从 10000 改为了 20000:
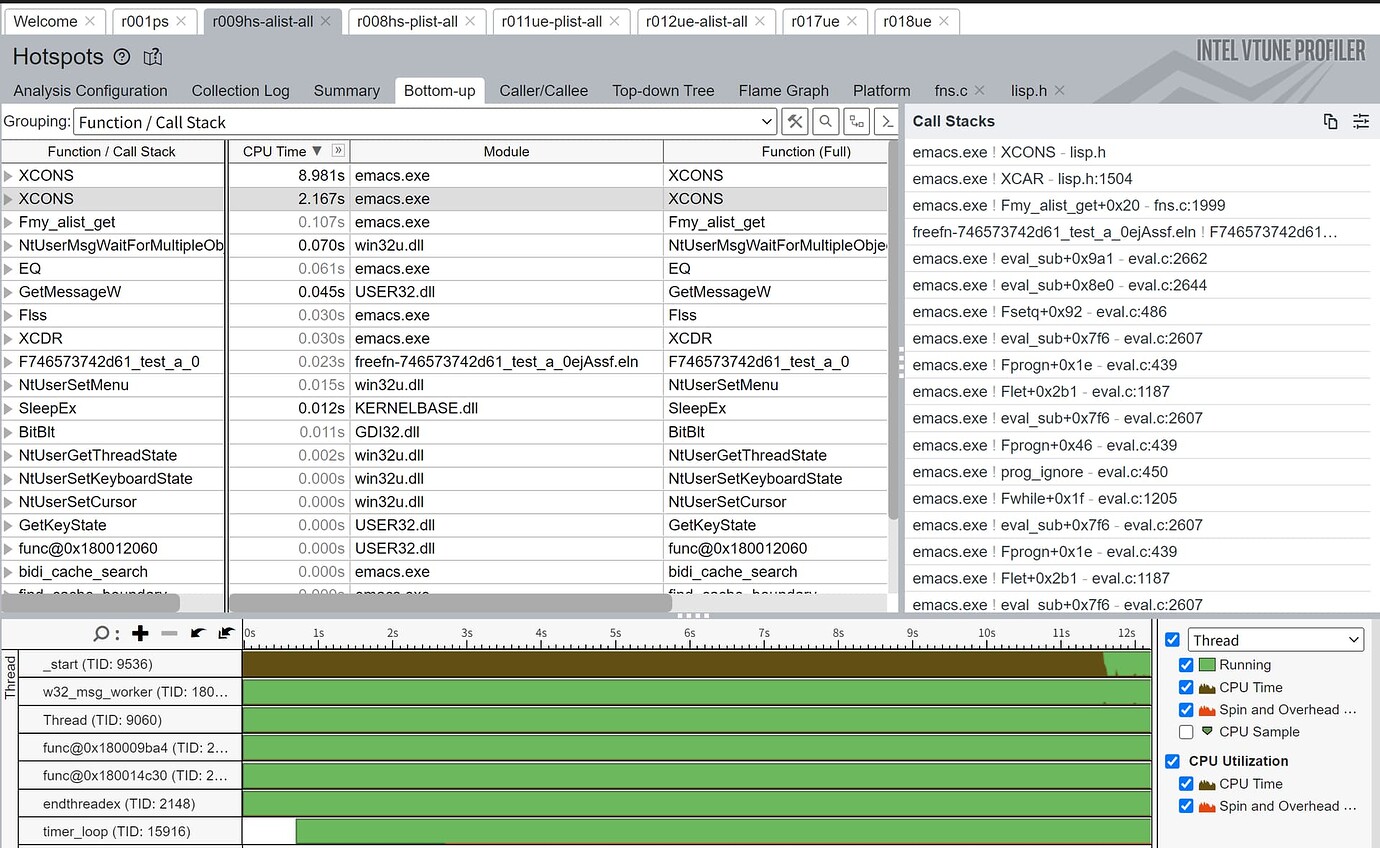
最前面的两条 XCONS 对应于汇编中的两条 LEA 指令,前一条 2.167s,后一条 8.981s,不知道是不是优化原因时间全算在 LEA 上了。
1320: 0f 84 8a 00 00 00 je 13b0 <Fmy_alist_get+0xc0>
1326: 48 8b 42 fd mov -0x3(%rdx),%rax
132a: 4c 8d 42 fd lea -0x3(%rdx),%r8 ;; 2.167s
132e: 4c 89 c9 mov %r9,%rcx
1331: 48 8b 50 fd mov -0x3(%rax),%rdx
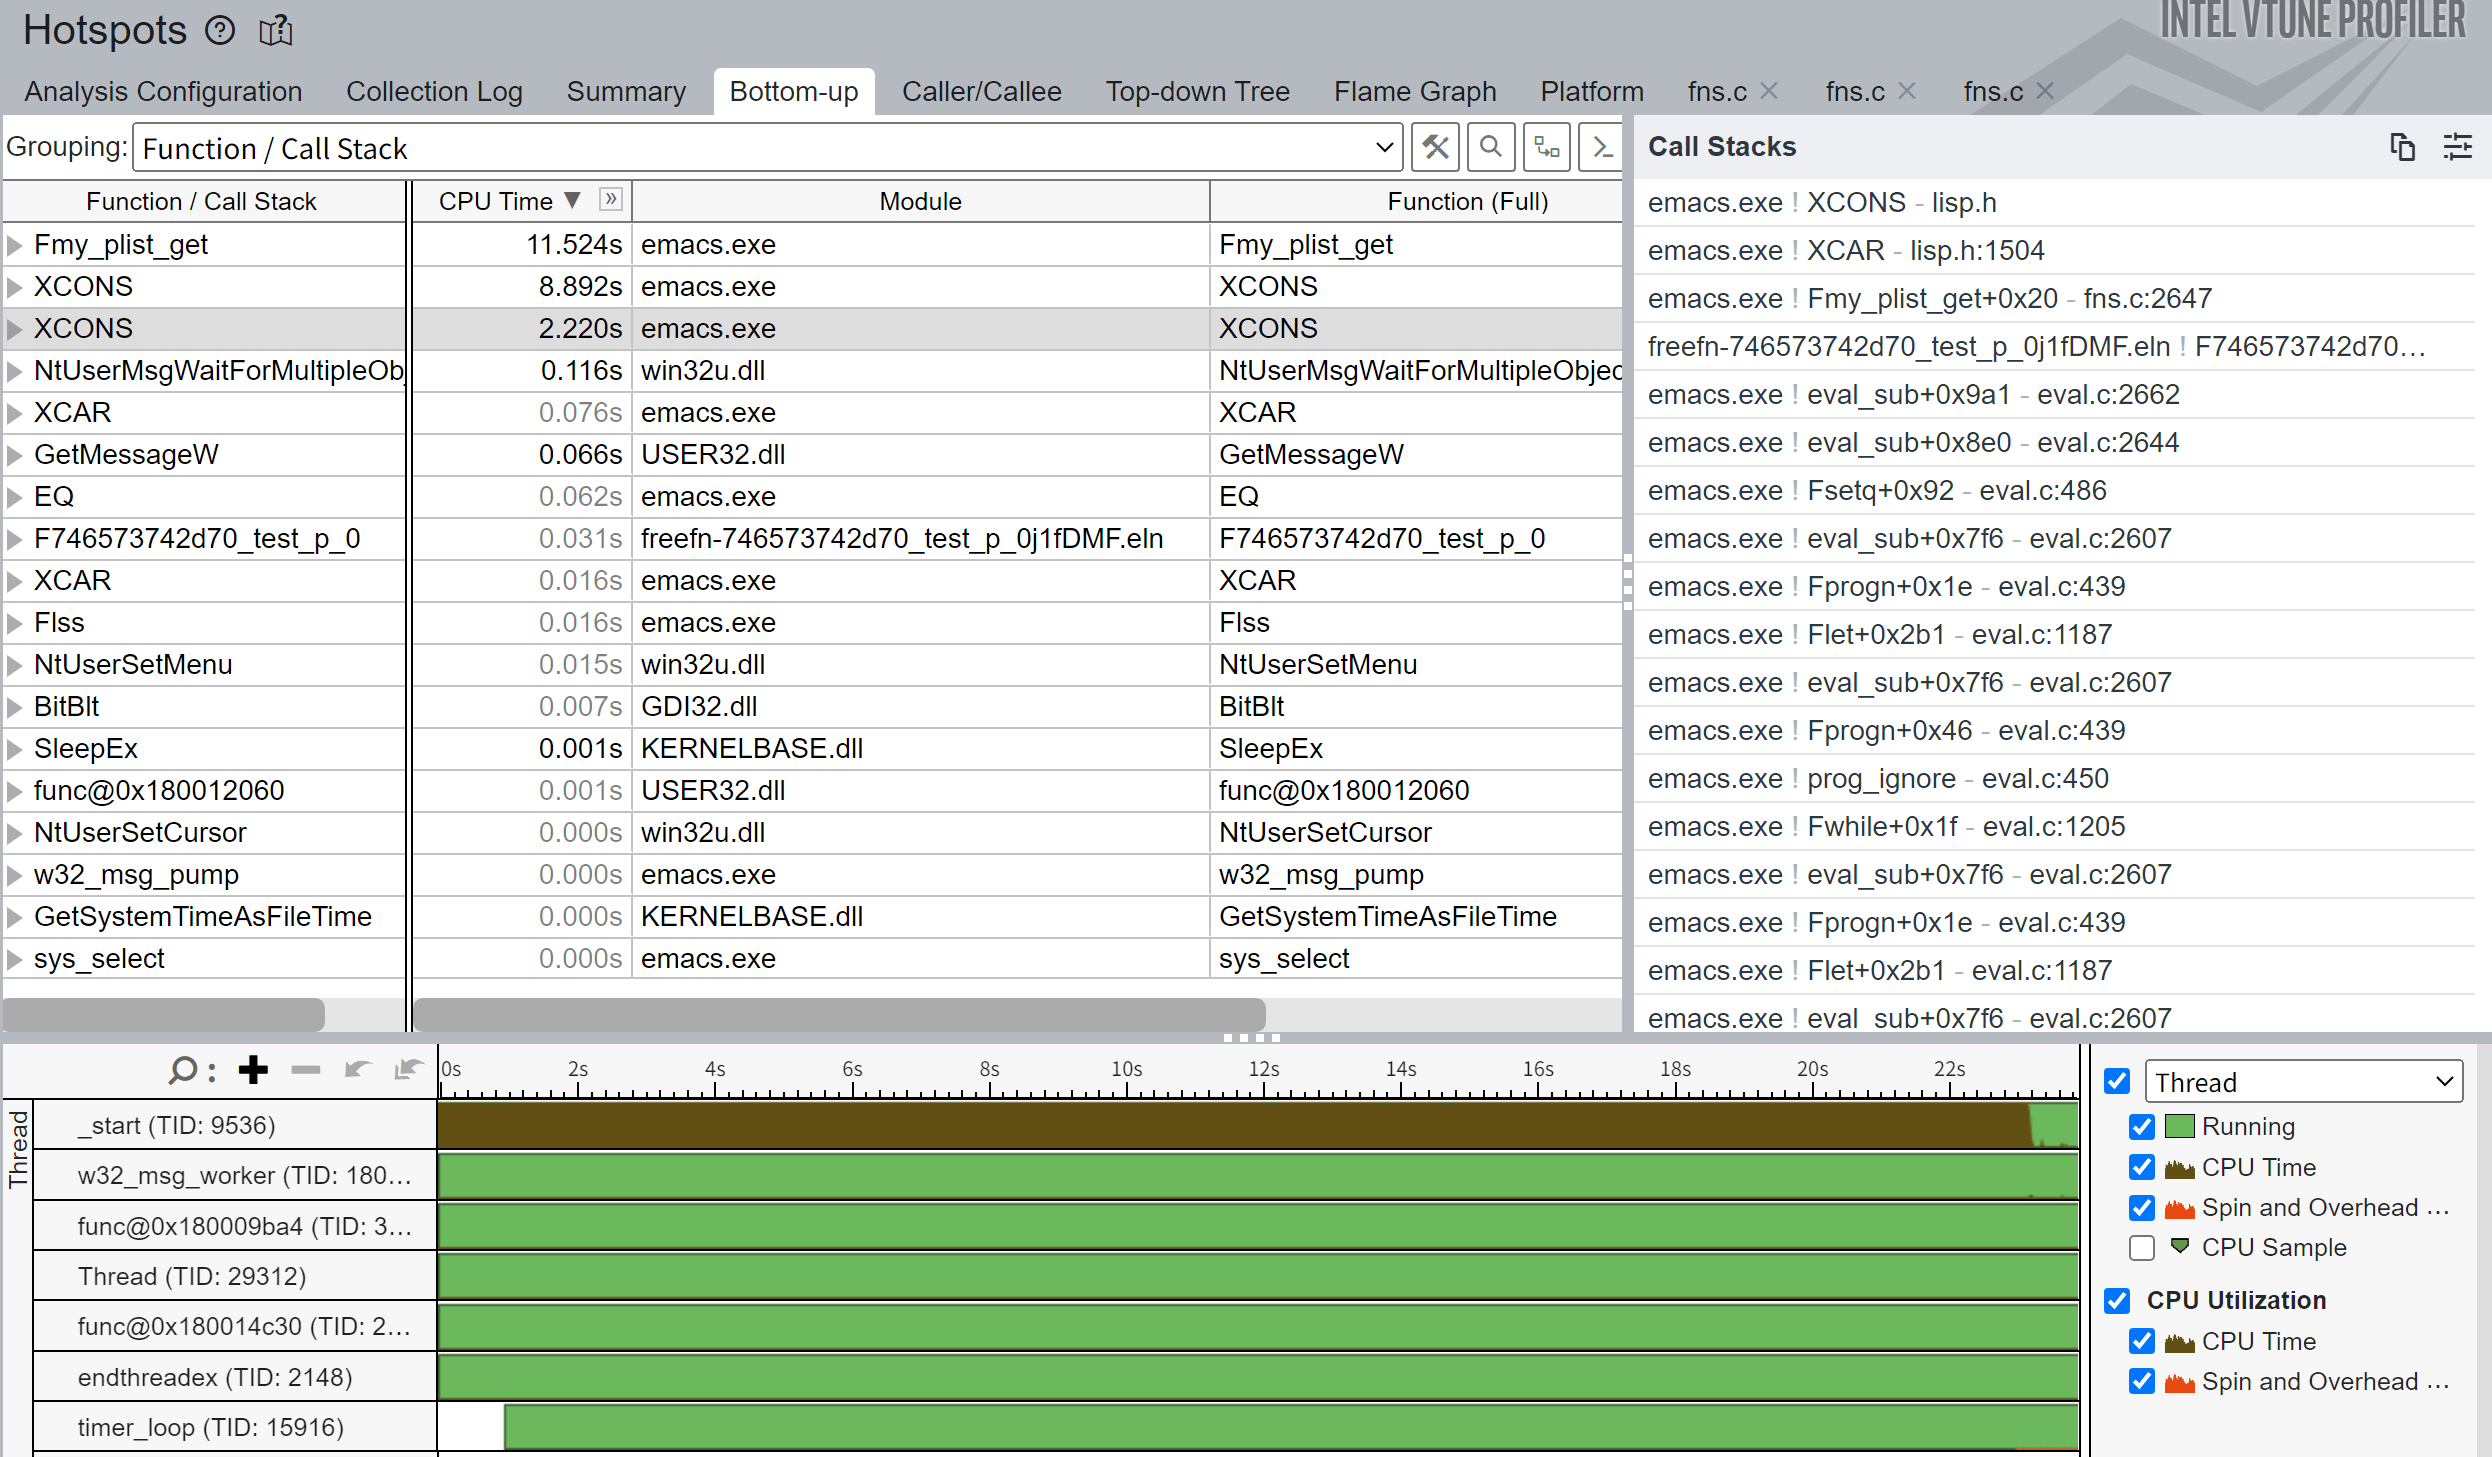
1335: 4c 8d 58 fd lea -0x3(%rax),%r11 ;; 8.981splist 的测试和 alist 的唯一区别是多出的 Fmy_plist_get 时间,差不多正好是两条 XCONS 用时之和,我也不太懂为什么把时间统计到它上面了…
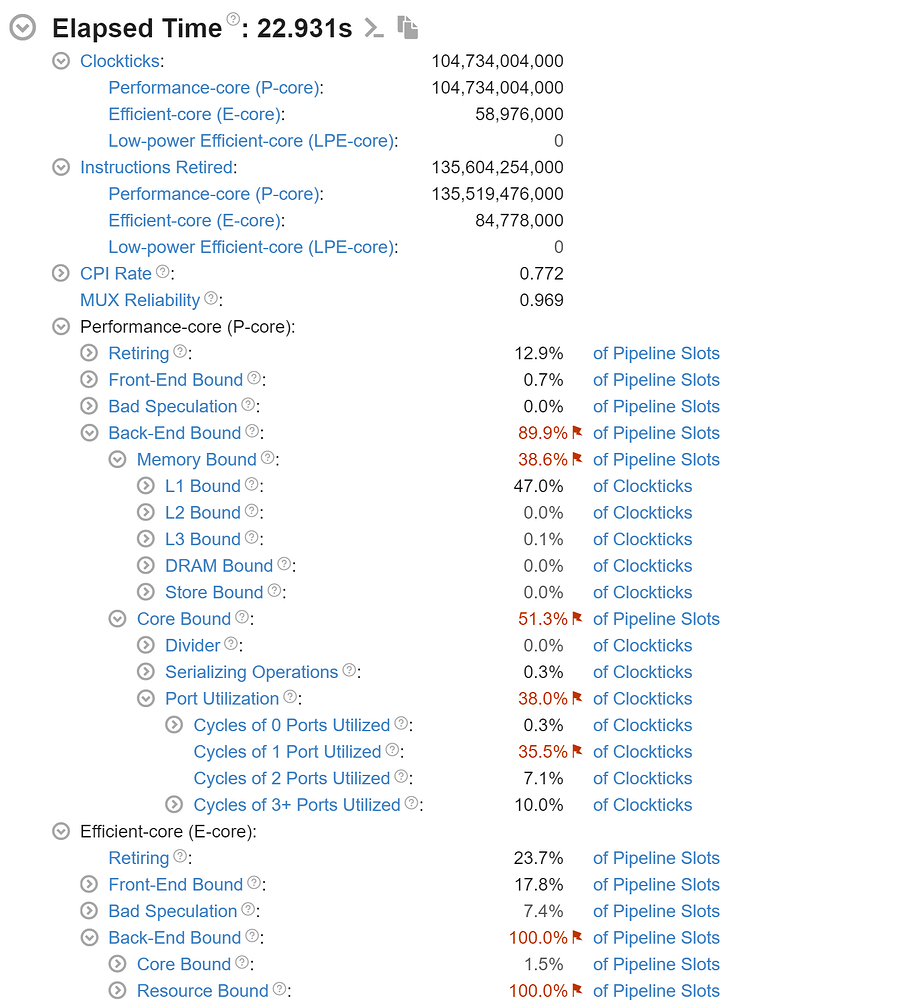
下图分别是对 plist 和 alist 的 Microarchitecture 测试,以及 VTune 对各项指标的解释说明,我只摘取了标红的指标说明:
 |
 |
- MUX Reliability
- This metric estimates reliability of HW event-related metrics. Since the number of collected HW events exceeds the number of counters, VTune Profiler uses event multiplexing (MUX) to share HW counters and collect different subsets of events over time. This may affect the precision of collected event data. The ideal value for this metric is 1. If the value is less than 0.7, the collected data may be not reliable.
- Memory Bound
- This metric shows how memory subsystem issues affect the performance. Memory Bound measures a fraction of slots where pipeline could be stalled due to demand load or store instructions. This accounts mainly for incomplete in-flight memory demand loads that coincide with execution starvation in addition to less common cases where stores could imply back-pressure on the pipeline.
- L1 Bound
- This metric estimates how often the CPU was stalled without loads missing the L1 Data (L1D) cache. The L1D cache typically has the shortest latency. However, in certain cases like loads blocked on older stores, a load might suffer due to high latency even though it is being satisfied by the L1D. Another example is loads who miss in the TLB. These cases are characterized by execution unit stalls, while some non-completed demand load live in the machine without having that demand load missing the L1 cache.
- Core Bound
- This metric represents how much Core non-memory issues were of a bottleneck. Shortage in hardware compute resources, or dependencies software's instructions are both categorized under Core Bound. Hence it may indicate the machine ran out of an OOO resources, certain execution units are overloaded or dependencies in program's data- or instruction- flow are limiting the performance (e.g. FP-chained long-latency arithmetic operations).
- Cycles of 1 Port Utilized
- This metric represents cycles fraction where the CPU executed total of 1 uop per cycle on all execution ports (Logical Processor cycles since ICL, Physical Core cycles otherwise). This can be due to heavy data-dependency among software instructions, or oversubscribing a particular hardware resource. In some other cases with high 1_Port_Utilized and L1 Bound, this metric can point to L1 data-cache latency bottleneck that may not necessarily manifest with complete execution starvation (due to the short L1 latency e.g. walking a linked list) - looking at the assembly can be helpful.
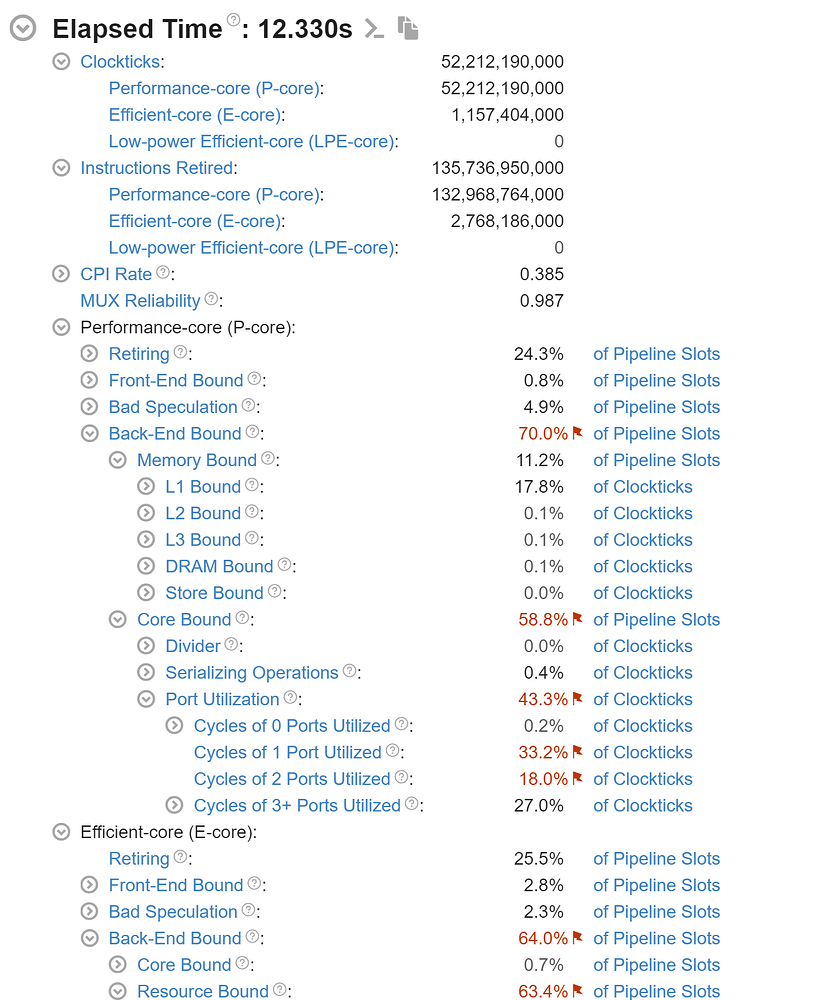
从测试结果来看,L1 Bound 和 Cycles of 1 Port Utilized 是最大的影响因素,我不知道为什么还有不到千分之一的指令跑到小核上去了,直接忽略。下图是一些关键指标的对比表格,以及所有测试数据表格:
| NAME | CPI | Memory Bound | L1 Bound | Core Bound | Port Utilization | 0 | 1 | 2 | 3+ |
|---|---|---|---|---|---|---|---|---|---|
| plist | 0.772 | 38.6% | 47.0% | 51.3% | 38.0% | 0.3% | 35.5% | 7.1% | 10.0% |
| alist | 0.385 | 11.2% | 17.8% | 58.8% | 43.3% | 0.2% | 33.2% | 18.0% | 27.0% |
| SUMMARY | ALIST | PLIST |
| Elapsed Time | 12.330s | 22.931s |
| Clockticks | 52,212,190,000 | 104,734,004,000 |
| Performance-core (P-core) | 52,212,190,000 | 104,734,004,000 |
| Efficient-core (E-core) | 1,157,404,000 | 58,976,000 |
| Low-power Efficient-core (LPE-core) | 0 | 0 |
| Instructions Retired | 135,736,950,000 | 135,604,254,000 |
| Performance-core (P-core) | 132,968,764,000 | 135,519,476,000 |
| Efficient-core (E-core) | 2,768,186,000 | 84,778,000 |
| Low-power Efficient-core (LPE-core) | 0 | 0 |
| CPI Rate | 0.385 | 0.772 |
| MUX Reliability | 0.987 | 0.969 |
| Performance-core (P-core) | ||
| Retiring | 24.3% | 12.9% |
| Front-End Bound | 0.8% | 0.7% |
| Bad Speculation | 4.9% | 0.0% |
| Back-End Bound | 70.0% | 89.9% |
| Memory Bound | 11.2% | 38.6% |
| L1 Bound | 17.8% | 47.0% |
| L2 Bound | 0.1% | 0.0% |
| L3 Bound | 0.1% | 0.1% |
| DRAM Bound | 0.1% | 0.0% |
| Store Bound | 0.0% | 0.0% |
| Core Bound | 58.8% | 51.3% |
| Divider | 0.0% | 0.0% |
| Serializing Operations | 0.4% | 0.3% |
| Port Utilization | 43.3% | 38.0% |
| Cycles of 0 Ports Utilized | 0.2% | 0.3% |
| Cycles of 1 Port Utilized | 33.2% | 35.5% |
| Cycles of 2 Ports Utilized | 18.0% | 7.1% |
| Cycles of 3+ Ports Utilized | 27.0% | 10.0% |
| Efficient-core (E-core) | ||
| Retiring | 25.5% | 23.7% |
| Front-End Bound | 2.8% | 17.8% |
| Bad Speculation | 2.3% | 7.4% |
| Back-End Bound | 64.0% | 100.0% |
| Core Bound | 0.7% | 1.5% |
| Resource Bound | 63.4% | 100.0% |
| Memory Scheduler | 0.3% | 0.0% |
| Non-memory Scheduler | 73.1% | 4.5% |
| Register | 0.0% | 0.0% |
| Full Re-order Buffer (ROB) | 0.0% | 0.0% |
| Serializing Operations | 0.9% | 7.4% |
| Info Metrics | ||
| Store Bound | 0.0% | 0.0% |
| Load Bound | 3.6% | 11.9% |
| L1 Bound | 1.2% | 0.0% |
| L2 Bound | 50.0% | 100.0% |
| L2 Miss | 75.0% | 0.0% |
| L3 Bound | 0.0% | 100.0% |
| L3 Miss | 75.0% | 0.0% |
| Low-power Efficient-core (LPE-core) | ||
| Retiring | 0.0% | 0.0% |
| Front-End Bound | 0.0% | 0.0% |
| Bad Speculation | 0.0% | 0.0% |
| Back-End Bound | 0.0% | 0.0% |
| Info Metrics | ||
| Average CPU Frequency | 4.7 GHz | 4.8 GHz |
| Total Thread Count | 3 | 3 |
| Paused Time | 0s | 0s |
上一节中的 VTune 指标说明中,Cycles of 1 Port Utilized 有几句话也许值得重复一下:
- Cycles of 1 Port Utilized
This can be due to heavy data-dependency among software instructions, or oversubscribing a particular hardware resource.…
In some other cases with high 1_Port_Utilized and L1 Bound, this metric can point to L1 data-cache latency bottleneck that may not necessarily manifest with complete execution starvation (due to the short L1 latency e.g. walking a linked list) - looking at the assembly can be helpful.
当 L1 Bound 和 Cycles of 1 Port Utilized 指标都比较高时,这表明可能存在一个 L1 数据缓存延迟瓶颈,这意味着即使数据在最快的 L1 缓存中,访问它仍然需要一些时间。以遍历链表为例,由于 L1 延迟很短,这一延时不一定会表现为完全的执行单元停顿(complete execution starvation)。
这一描述与我们上面的 Hotspots 测试是吻合的,因为 LEA 执行只需要一个指令周期,而 L1-cache hit 一般需要 5 个周期,缓存访问的时间被“错误”地算在了 LEA 上。考虑到上面的测试数据中 CPU 的平均频率是 4.7GHZ, (5 * 1 / 4.7HZ * 1E9) = 1.06ns ,差不多与 my-plist-get 和 my-alist-get 的键值对位置序号/访问时间的曲线斜率吻合。
@cireu 在 15 楼提出 pointer chasing 后,@shynur 在 18 楼写道:
>
(:a 1 :b 2 :c 3) => (:a . (1 . (:b . (2 . (:c . (3 . nil))))))
>((a . 1) (b . 2) (c . 3)) => ((a . 1) . ((b . 2) . ((c . 3) . nil)))访问
plist[:b]: 第一次 car 发现是:a, 再 cdr 两次到:b, car 一下发现是要找的键值对, 再 cdr + car 拿到值. 总共 三次 car + 三次 cdr访问
alist[:b]: car 两次发现是:a, 再 cdr + car 拿到下一个键值对, 再 car 发现 key 是:b, 再 cdr 拿到值. 总共 四次 car + 两次 cdr理论上的算法复杂度根本没有任何区别
如果代码是顺序执行的话 ,plist/alist 的查找理论上的算法复杂度根本没有任何区别。但我们可以注意到 my-plist-get 和 my-alist-get 中 遍历 和 键值判断 是 可以并行 的。实际的执行过程中,由于 CPU 的 OOE(乱序执行,Out-of-Order Execution),alist 中键值判断的 (eq (car (car alist)) key) 与遍历操作 (cdr alist) 可以并行;plist 中的 (eq (car plist)) 与遍历操作 (cdr (cdr plist)) 可以并行,因此实际的查找用时取决于查找项的位置(列表遍历用时)与最后一次键比较和取值用时。
作为补充说明,我们可以测试一下使用 pesudo-pget 和 pesudo-aget 时的键值对序号/时间曲线,测试代码依旧不变,将 my-a/plist-get 改为 pesudo-a/pget 即可:
解释函数的曲线与 CAR/CDR 开销几乎相等这一事实非常吻合(2CAR + 1CDR = 2CDR + 1CAR),native-comp 编译后的代码也与 my-a/plist-get 曲线(更准确地说是 plist-get 和 alist-get 曲线)非常接近。比较让我惊讶的是从字节编译开始 pesudo-aget 就比 pesudo-pget 快了,下面是它们的字节编译码:
byte-comp-code
byte code for pesudo-aget:
  doc:   ...
  args: (arg1 arg2)
0:1	dup
1	goto-if-nil 2
4	dup
5	car
6	car
7	stack-ref 2
8	eq
9	goto-if-not-nil 2
12	cdr
13	goto	  1
16:2	dup
17	goto-if-nil-else-pop 3
20	dup
21	car
22	cdr
23:3	return
byte code for pesudo-pget:
doc: ...
args: (arg1 arg2)
0:1 stack-ref 1
1 goto-if-nil 2
4 stack-ref 1
5 car
6 stack-ref 1
7 eq
8 goto-if-not-nil 2
11 stack-ref 1
12 cdr
13 cdr
14 stack-set 2
16 goto 1
19:2 stack-ref 1
20 goto-if-nil-else-pop 3
23 stack-ref 1
24 cdr
25 car
26:3 return - 省流版
- pointer chasing,越长越慢。
- 完整版
- 造成 eq 比较 alist/plist 性能差距的原因是在列表遍历过程中 plist 每次需要两次 CDR 而 alist 只需要一次,由于键值比较操作与列表遍历操作可并行且键值比较操作用时远小于内存读取开销(甚至是 L1-cache hit 开销)且链表遍历操作难以并行,查找的主要时间开销来源是在从表头到键值对所在位置的遍历过程。
虽然在一开始我就认为 plist 和 alist 查找性能差距的主要原因是 plist 更长,但是要比较严谨地说明这一点并不是那么容易。通过这一次折腾我也是学会了怎么用性能测试工具和读简单的汇编。
感谢参与讨论的各位坛友。